Reproducing the Topology Bake-Off on a Second Machine
Abstract
A larger follow-up to the first post will run on a DGX Spark (aarch64), so I first tested whether its evaluation reproduces there, re-running three of its encoders on the original laptop (x86_64) and on the Spark. The cosine-geometry metrics (Layer 1) reproduced to four decimals across the two machines. The Mapper layer did not, and the check exposed an error of mine: the first post's anchor ρ is a single, badly sampled draw. A per-seed estimator with standard errors brings the machines into agreement across all 15 of the first post's evaluation rows and corrects one of its claims.
Cosine geometry of the embedding models reproduces across CPU architectures. Mapper graphs, built on a seeded UMAP projection, do not, so a second machine effectively acts like a new random seed. The first post's anchor ρ, which asks whether graph distance tracks surface features like prompt length, grammar, reading ease, etc., came from one Mapper graph and about eleven documents. Averaged over 25 graphs, the laptop and the DGX Spark agree within their error bars across all 15 evaluation rows. The first post's MMLU story survives, but its SciCUEval anchor ρ ranking was mostly noise, MedCPT's "outright" win included.
What the first post measured
The first post ranked 14 encoders (15 evaluation rows, since EmbeddingGemma ran with and without its prescribed prefix) on two corpora of multiple-choice prompts: SciCUEval (biomedical) and MMLU (general knowledge, non-STEM). Each encoder turns a prompt into a vector, so a corpus becomes a cloud of points in 384 to 1,024 dimensions, measured in three layers:
- Cosine geometry (Layer 1). How much closer same-subject prompts sit than different-subject ones (the cosine gap), and how well a linear classifier recovers the subject from the vectors (LR accuracy).
- Mapper (Layer 2). A summary of the cloud's shape as a graph. A lens projects every point to a low-dimensional view, here a 2-D UMAP that depends on a random seed. A cover tiles that view with overlapping bins, the points in each bin are clustered by their full-dimensional cosine distances (HDBSCAN), each cluster becomes a node, and clusters that share prompts are joined by an edge. Repeating this for 25 seeds gives 25 graphs, and the ARI (adjusted Rand index) scores how consistently pairs of graphs group the same prompts: 1 for identical, 0 for chance.
- Linguistic anchors (Layer 3). Anchor ρ is the Spearman correlation, over pairs of prompts, between how many hops apart they sit in the graph and how different their surface features are (length, reading ease, vocabulary difficulty). High ρ means the graph is laid out along those gradients.
Setup
A larger follow-up will run on a DGX Spark, which is aarch64 where the first post ran on x86_64, so I first checked whether the evaluation reproduces there.
It started with three of the encoders, biomedbert-fulltext, minilm and bge-base, run on both machines with the same code, seeds and evaluation sample:
| laptop | DGX Spark | |
|---|---|---|
| CPU | x86_64, 16 cores | aarch64, 20 cores |
| GPU | RTX 4070 Laptop, 8 GB | GB10 (Blackwell) |
| torch | 2.6.0 (as in the first post) | 2.13.0 (2.6.0 predates Blackwell) |
Most of it reproduced, but the check turned up an error of mine in the first post, so I widened it to all 15 evaluation rows to see how far the error reached. Finding and fixing your own mistakes is part of the job; this post is that correction.
Cosine reproduces; Mapper doesn't
The encoded vectors barely differ: every prompt's vector on the Spark has a cosine similarity of at least 0.9999996 with its laptop counterpart, and no coordinate moves by more than 4 × 10⁻⁶ of the largest one. On the laptop they are bit-identical to the first post's cached vectors from May. Layer 1 matched on both machines: the cosine gap to four decimals on all six rows, and logistic-regression accuracy to within one held-out prediction. On the laptop, the Mapper layer also matched the first post exactly on SciCUEval, down to node counts. On the Spark, mean ARI moved by up to 0.05:
| row | ARI, laptop | ARI, Spark | two-SE bound |
|---|---|---|---|
biomedbert-fulltext SciCUEval | 0.818 | 0.799 | 0.037 |
biomedbert-fulltext MMLU | 0.701 | 0.692 | 0.066 |
minilm SciCUEval | 0.757 | 0.807 | 0.047 |
minilm MMLU | 0.829 | 0.798 | 0.045 |
bge-base SciCUEval | 0.766 | 0.783 | 0.039 |
bge-base MMLU | 0.849 | 0.845 | 0.040 |
The bound is two jackknife standard errors of the difference (more on that below).
Five rows fall inside it; minilm SciCUEval sits just outside, 0.050 against 0.047, which six comparisons at this threshold produce about a quarter of the time.
That is expected. Different architectures round floating-point sums differently in the last bits, through fused multiply-adds, reassociated reductions and their math libraries. Most numerical codes absorb that. A seeded UMAP amplifies it into a different layout, the Mapper cover bins that layout differently, and HDBSCAN clusters the bins differently, so another architecture behaves like another seed. Bitwise identity across machines takes deliberate engineering, such as fixed-order parallel reductions (Siklósi et al., 2024), and the relevant standard here is the weaker one: results consistent within their own uncertainty (National Academies, 2019). Within one machine, fixed order is cheap: the bootstrap now aggregates seeds in seed order, and reruns agree bit for bit.
Pinning the environment doesn't close the gap either. Both machines ran the same lockfile apart from torch, which buys what Malka, Zacchiroli and Zimmermann (2026) call rebuildability, not bitwise identity, and that one exception turns out to matter as much as the CPU (below).
That standard needs error bars, which is where the first post's anchor ρ fell short.
The anchor ρ in the first post was a single draw
The implementation from the first TDA blog post computes anchor ρ once, on the seed-42 graph, from a 500-document subsample, stopping at 5,000 pairs.
Those pairs are taken in itertools.combinations order: the first document against the other 499, then the second, and so on.
Every pair therefore touches one of the first eleven documents.
A synthetic check makes the consequence concrete. On a path-shaped graph whose features track position, I corrupted 20 of 500 documents. Pairs drawn uniformly still give ρ = +0.92; the combinations-order estimator gives −0.82, because all of its pairs run through the corrupted documents.
The replacement draws 5,000 pairs uniformly on every one of the 25 bootstrap graphs and reports their mean and spread. For the three encoders run on both machines:
| row | single draw, laptop | single draw, Spark | per-seed mean ± sd, laptop | per-seed mean ± sd, Spark |
|---|---|---|---|---|
biomedbert-fulltext SciCUEval | 0.249 | 0.199 | 0.216 ± 0.158 | 0.207 ± 0.087 |
biomedbert-fulltext MMLU | 0.476 | 0.322 | 0.230 ± 0.204 | 0.209 ± 0.155 |
minilm SciCUEval | 0.059 | 0.457 | 0.262 ± 0.126 | 0.265 ± 0.128 |
minilm MMLU | 0.036 | 0.015 | 0.083 ± 0.121 | 0.031 ± 0.076 |
bge-base SciCUEval | 0.195 | 0.227 | 0.257 ± 0.128 | 0.304 ± 0.133 |
bge-base MMLU | −0.009 | 0.440 | 0.117 ± 0.125 | 0.170 ± 0.207 |
The single draws disagree across machines by up to 0.45. The per-seed means agree within two standard errors on all six rows.
Which difference matters, the torch build or the CPU?
Even vectors that close are only 2–6% bit-identical, and that is enough.
Swapping embeddings between machines for minilm on SciCUEval shows that each difference acts like a new seed on its own:
| embeddings | Mapper on laptop | Mapper on Spark |
|---|---|---|
| laptop | single draw 0.059, mean 0.262 | single draw 0.334, mean 0.311 |
| Spark | single draw 0.293, mean 0.238 | single draw 0.457, mean 0.265 |
The single draw spans 0.06 to 0.46 across the four cells; the per-seed mean spans 0.24 to 0.31.
- Anchor ρ is now two numbers. The first post's single draw is still computed, unchanged. The headline value is now the mean over 25 graphs, with its spread.
- The new estimator differs in three ways: pairs are drawn uniformly rather than in
combinationsorder, each seed draws its own 500-document subsample, and a graph too sparse to score is skipped instead of counted as zero. - ARI keeps its definition and gains a jackknife standard error.
- Seeds are now aggregated in seed order. That moves the means only in the last bit, and it makes reruns bit-identical.
So the per-seed numbers here are not directly comparable with the anchor ρ tables in the first post.
A correction to the first post
Every anchor ρ in the first post was a single draw, and across its encoders the per-seed spread is 0.08 to 0.20, so two single draws of the same encoder typically differ by 0.1 to 0.2. To see which claims survive, I re-ran the per-seed estimator on the first post's own cached vectors for all 15 rows; on the laptop that reproduces every published SciCUEval single draw exactly, so only the estimator changed.
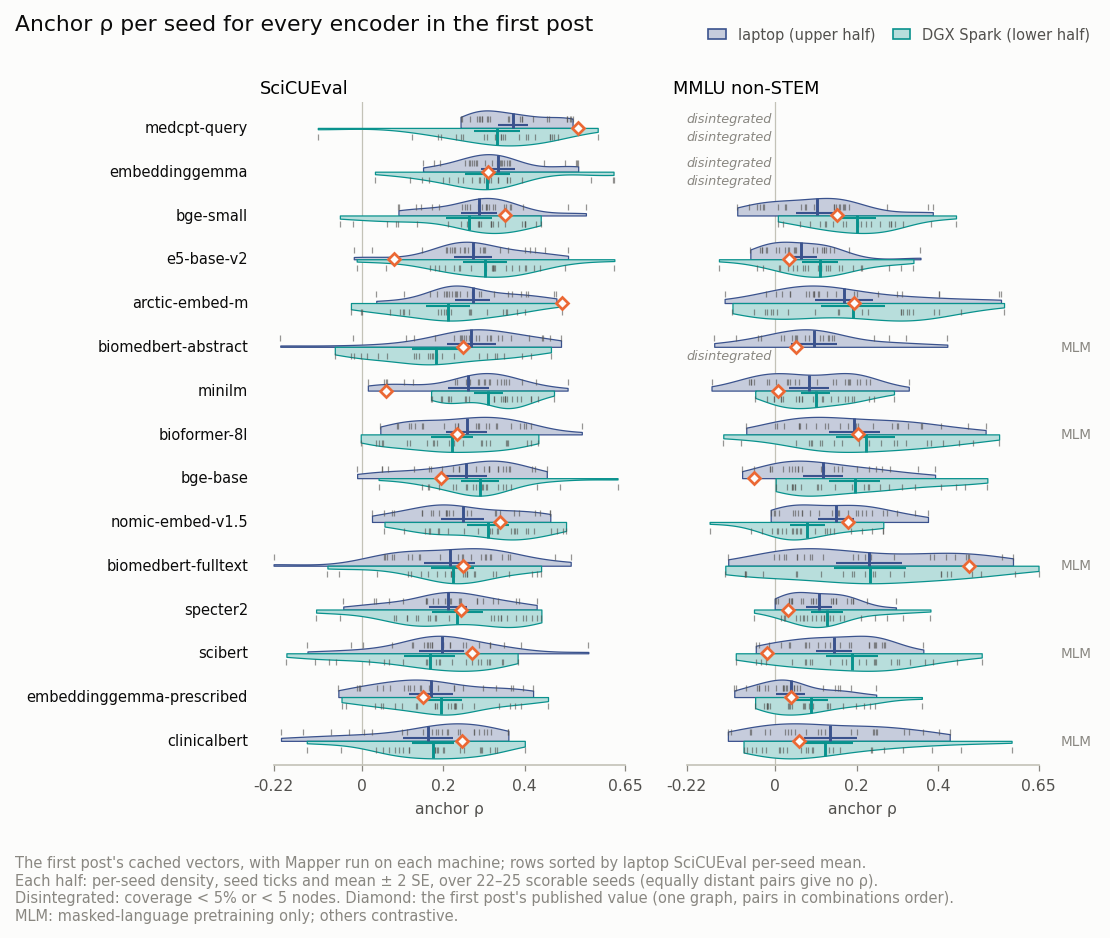
- SciCUEval: the ranking was mostly noise. All 15 per-seed means fall between 0.16 and 0.37, with standard errors of 0.02 to 0.03.
medcpt-querystill comes first at 0.37, but only 1.3 standard errors ahead ofembeddinggemma, so it doesn't win "outright"; its published 0.53, likearctic-embed-m's 0.49, was a high draw.minilmande5-base-v2, the first post's bottom two, sit mid-pack, and the MLM encoders average slightly below the contrastive ones. - MMLU: the story broadly survives. The top two rows are MLM encoders (
biomedbert-fulltext0.23,bioformer-8l0.20), andminilm,e5-base-v2andembeddinggemma-prescribedsit at the bottom (0.04 to 0.08). The first post's reading, that MLM encoders fall back on surface features when the content signal thins out and contrastive ones fall through them, holds here. - The machines agree across the roster. With the same vectors and Mapper run on each machine, per-seed means agree within two standard errors on 24 of 27 scorable rows. The three misses exceed the bound by at most 1.5×, which 27 comparisons produce about one time in eight.
Why not a deterministic lens + Mapper?
PCA would remove the seed entirely, so I checked what it would measure.
The top two principal components carry only 7.5–21% of the variance, and they track the surface features more strongly than the UMAP axes do: up to |ρ| = 0.67 against 0.39.
Contrastive training also flattens the spectrum; on SciCUEval the first component holds 13% of the variance for biomedbert-fulltext and 7–8% for the two contrastive models.
So a PCA-lens anchor ρ would partly measure the shape of the spectrum rather than neighborhood structure, and would separate contrastive from MLM encoders for that reason alone.
I kept UMAP and added error bars.
ARI needs a jackknife
Mean ARI averages 300 pairs of seeds, and those pairs share seeds. Dividing their spread by √25 ignores that sharing and understates the standard error, by a factor of about √2 when each seed contributes additively. The evaluation now reports a leave-one-seed-out jackknife instead.
Loose ends
- On the laptop, 7 of 15 MMLU rows differ slightly from the first post (ARI by up to 0.03), from the same cached vectors on the same machine, while every SciCUEval row reproduces exactly. The mismatches interleave with exact rows computed in the same session, so it isn't a library change mid-run, and evaluation order is ruled out. I haven't found the cause.
- Disintegration, a Mapper graph that covers under 5% of prompts, is a threshold, so a borderline row can flip between machines:
biomedbert-abstracton MMLU covers 5.3% of prompts on the laptop and 4.96% on the Spark. - On the Spark, the aarch64 build of numba has no TBB and falls back to GNU OpenMP, which kills forked worker processes. Setting
NUMBA_THREADING_LAYER=forksafefixes it.
What this sets up
Per-seed anchor ρ has a standard error of 0.02 to 0.04 per row, so two encoders, or two versions of one, need to differ by roughly 0.09 before the difference means anything. That is the resolution the larger follow-up will work with.