Beyond Massive Text Embedding Benchmarks (MTEB): A Topology-Aware Embedder Bake-Off Across Two Corpora
Abstract
I ran 14 open-weights text encoders (15 evaluation rows; EmbeddingGemma was run twice, once with the same config as the other models and once with its prescribed task prefix). Here I use multi-layer evaluation crtieria. Specifically, cosine geometry plus a 25-seed UMAP bootstrap into KeplerMapper, applied to a biomedical corpus (SciCUEval) and a general-knowledge corpus (MMLU non-STEM). The cosine ranking rewards aggressive contrastive training. The topology layer reorders everything. The contrastive-biomedical encoder MedCPT wins continuous-anchor faithfulness outright. PubMed-pretrained MLMs (masked language models) that 'collapse' in cosine space recover clean topological structure. Architecture barely moves the needle; training regime does.
Why Massive Text Embedding Benchmarks (MTEB) Alone Won't Pick Your Embedder
A text embedder is a model that turns a string of text into a fixed-length vector to use in mathematical operations. Semantically similar strings map to nearby vectors. MTEB is great for one thing: telling you which embedders score highest on a fixed benchmark suite of retrieval and similarity tasks.
What it does not convey is whether your corpus has the same lexical distribution as the MTEB benchmark. MTEB also does not determine whether the embedder you're picking organizes its representation space in a way that respects the text corpus subject matter. I wanted to pick a text embedder for an LLM (large language model) router that classifies prompts by domain and complexity. The MTEB leaderboards say "use the latest sentence-transformer," and the bag-of-cosines bake-offs you see in many blog posts agree.
Adding Topological Information to Embedding Vectors
Each encoder maps every prompt to a point in a high-dimensional space (768 or 1024 numbers per prompt). The set of all those points has a shape.
Mathematically this is a low-dimensional surface, or manifold, sitting inside that high-dimensional space. Picture a sheet of paper crumpled inside a room. The paper is a 2D surface even though it occupies space in a 3D room. An embedder's output points trace something analogous. In this case, each prompt is a single point in the high-dimensional embedding space (the room), and the cloud of all those points lies on a lower-dimensional surface (the manifold — the paper). Topological data analysis (TDA) is a family of techniques for measuring that shape directly, instead of summarizing it through pairwise distances. When I reimagined and ran a bake-off myself, I added a second evaluation layer on top of cosine using TDA. The pipeline is UMAP (Uniform Manifold Approximation and Projection) as a stable lens into the encoder's output manifold, then KeplerMapper turning that lens into a graph. Across 25 UMAP seeds, I measure how stable that graph is (i.e. does the same encoder produce the same output shape regardless of UMAP's randomness?) and how well its distances track readable surface features of the multiple-choice question (MCQ) prompts.
The two metrics assessing topology are:
- anchor ρ - Spearman rank correlation between Mapper-graph distance and a panel of surface-text features, where 0 = no relationship, 1 = perfect.
- Read anchor ρ operationally: if two prompts sit near each other in the Mapper graph, are they also similar in surface features like length, reading ease, and vocabulary difficulty? High ρ means the manifold organizes documents along measurable linguistic gradients, while low ρ means it doesn't.
- Adjusted Rand Index (ARI) is a partition-agreement score, where 0 = random agreement, 1 = identical document-to-node assignments across two Mapper graphs.
Two observations fell out after adding a topological assessment of the embedders:
- The encoder that won cosine on both corpora (
minilm) finished dead last on whether the topology of its output manifold meant anything (anchor ρ = 0.006 on MMLU, 0.059 on SciCUEval). - Two BERT-base encoders with the same PubMed pretraining look indistinguishable on cosine (gap 0.011 vs 0.006 on MMLU) and land 11 ranks apart on TDA stability (ARI 0.842 vs 0.695).
This post is the bake-off, the methodology, and a contrast run between general-knowledge and biological corpora.
Setup: 14 Encoders, 2 Corpora, 3 Evaluation Layers
The encoder roster
The encoders:
| key | model | training era | role |
|---|---|---|---|
bioformer-8l | bioformers/bioformer-8L | 2022 | Smaller (8L) BERT, pretrained from scratch on PubMed |
biomedbert-abstract | microsoft/BiomedNLP-BiomedBERT-base-uncased-abstract | 2020 | BERT-base pretrained on PubMed abstracts |
biomedbert-fulltext | microsoft/BiomedNLP-PubMedBERT-base-uncased-abstract-fulltext | 2020 | BERT-base pretrained on PubMed abstracts + full text |
scibert | allenai/scibert_scivocab_uncased | 2019 | BERT-base pretrained on broader scientific corpus + custom WordPiece vocab |
clinicalbert | emilyalsentzer/Bio_ClinicalBERT | 2019 | BioBERT init + MLM continued on MIMIC-III clinical notes — distinct clinical-text training corpus, not research papers |
specter2 | allenai/specter2_base | 2024 | SciBERT init + citation-graph contrastive fine-tune |
medcpt-query | ncbi/MedCPT-Query-Encoder | 2023 | NCBI's PubMed-search encoder, contrastive-trained on actual user click logs — the contrastive-biomedical cell |
bge-base | BAAI/bge-base-en-v1.5 | 2024 | BERT-base trained with weakly-supervised + supervised contrastive pairs |
bge-small | BAAI/bge-small-en-v1.5 | 2024 | Same recipe as bge-base, smaller body |
arctic-embed-m | Snowflake/snowflake-arctic-embed-m | 2024 | BERT-base trained on web query-document pairs |
minilm | sentence-transformers/all-MiniLM-L6-v2 | 2021 | Distilled BERT trained with sentence-similarity contrastive loss |
e5-base-v2 | intfloat/e5-base-v2 | 2023 | BERT-base trained with weakly-supervised contrastive on web pairs; uses prescribed query:/passage: prefixes |
nomic-embed-v1.5 | nomic-ai/nomic-embed-text-v1.5 | 2024 | 273M, Matryoshka, 8192-token context, contrastive-trained with prescribed task prefixes |
embeddinggemma (naive) | google/embeddinggemma-300m | 2025 | Gemma3-derived 300M embedder. Run with raw mean-pool — apples-to-apples to the rest of the roster |
embeddinggemma-prescribed | google/embeddinggemma-300m | 2025 | Same weights as above, run with the model card's prescribed prefix — only the prefix varies |
NOTE: The dual-Gemma rows are intentional.
BERT-style models output one vector per token.
In order to get one vector per prompt, average the token vectors, weighted by which positions are real tokens (the 'attention mask') vs padding.
Pool is held constant at mean-over-attention-mask for all encoders so that the only variable separating the two Gemma rows is the prefix itself: task: classification \| query: {content}.
Not to spoil the tea, but how much does honoring the prescribed prefix actually move the numbers?
On the full 4000-prompt SciCUEval run the prefix bumps the cosine gap by ~50% relative (0.026 → 0.039); small enough that the apples-to-apples ranking is informative, large enough that the caveat is real.
Two training regimes show up across this roster: contrastive training shows the model pairs of texts and pulls 'similar' pairs closer in the output space while pushing everything else apart — the model learns what should be close. Masked language modeling (MLM) hides tokens in a sentence and asks the model to predict them — the model learns what tokens belong where. Contrastive training tends to produce tight clusters by meaning, while MLM produces a representation that tracks local linguistic structure as a byproduct. The 2x2 below crosses this objective axis with the corpus the model was trained on:
| General-purpose | Biomedical / scientific | |
|---|---|---|
| Contrastive | minilm, bge-small, bge-base, arctic-embed-m, e5-base-v2, nomic-embed-v1.5, embeddinggemma | medcpt-query, specter2 |
| MLM-only | (empty by design — bare BERT isn't an embedder) | bioformer-8L, biomedbert-abstract, biomedbert-fulltext, scibert, clinicalbert |
The contrastive-biomedical cell (top-right) turns out to be where one of the more interesting findings lives. Another caveat to consider: the MLM-only general-purpose cell is empty by design since bare BERT isn't a competitive embedding model and would just be a strawman.
The corpora
I picked two MCQ-style corpora with matching question shape but very different content:
- SciCUEval (Figshare deposit, CC-BY 4.0, doi:10.6084/m9.figshare.29924687): 11,343 multiple-choice questions across 10 sub-datasets covering biology, biomedicine, chemistry, materials, physics x text/tables/knowledge graphs (KGs). I stratified-sampled 400/sub-dataset = 4,000 prompts.
- MMLU (Hugging Face dataset, MIT): I picked 10 non-STEM subjects in 5 broad domains (humanities, social science, law/policy, business, common knowledge) and stratified-sampled 400/subject — capped by available data, ending at 2,450 prompts. Same stratification recipe, very different content.
Same prompt format (MCQ stem from each item), same per-class budget — so the comparison isolates content domain, not prompt style.
The three evaluation layers
prompts → [encode]
            ↓
       embedding matrix (n x d)
            ↓
       ┌─────────────────────────────┐
       │ Layer 1: cosine geometry    │  within/between μ, centroid heatmap, LR acc
       └─────────────────────────────┘
            ↓
       ┌─────────────────────────────┐
       │ Layer 2: TDA / Mapper       │  25-seed UMAP bootstrap, ARI/NMI stability
       │  - KeplerMapper +           │
       │    HDBSCAN(precomputed cos) │
       └─────────────────────────────┘
            ↓
       ┌─────────────────────────────┐
       │ Layer 3: linguistic anchors │  textstat features as ground truth
       │  - categorical purity       │
       │  - graph-vs-textstat ρ      │
       │  - per-feature alignment    │
       └─────────────────────────────┘
n = number of prompts (4,000 for SciCUEval, 2,450 for MMLU). d = embedding dimension (typically 384, 512, 768, or 1024 depending on encoder). μ = mean. ρ = Spearman rank correlation. ARI/NMI are partition-agreement scores between clusterings, both ∈ [0,1]. LR acc = downstream-classifier accuracy from a logistic regression fit on raw embeddings.
The methodology owes a lot to recent TDA-for-NLP (natural language processing) work — TopoBERT (Rathore et al. 2023) for the Mapper-as-diagnostic framing, the 2025 "When Annotators Disagree, Topology Explains" paper for the seed-bootstrap motivation, and Draganov & Skiena (2024) for the linguistic-anchor-faithfulness idea.
NOTE: All three layers run on L2-normalized embeddings with cosine distance throughout, since mixing metrics across embedders silently invalidates comparisons.
Cosine bake-offs measure how aggressively the embedder was trained to spread pairs apart, not whether its output geometry has anything to do with your corpus. Adding a topological analysis layer reorders the ranking and reveals two distinct domain-shift failure modes. MLM-pretrained encoders fall back on linguistic surface features when content signal vanishes, while contrastive-pretrained encoders fall through them entirely.
Layer 1: Cosine Geometry, And Why LR Accuracy Is Misleading
Within vs between cosine, on SciCUEval
Sorted by within-vs-between cosine gap (bigger = more separation in the embedding space):
| rank | encoder | within μ | between μ | gap | centroid off-diag μ | LR acc |
|---|---|---|---|---|---|---|
| 1 | minilm | 0.377 | 0.167 | 0.210 | 0.449 | 0.964 |
| 2 | nomic-embed-v1.5 | 0.609 | 0.483 | 0.125 | 0.797 | 0.983 |
| 3 | bge-small | 0.606 | 0.484 | 0.122 | 0.801 | 0.965 |
| 4 | arctic-embed-m | 0.663 | 0.569 | 0.094 | 0.857 | 0.985 |
| 5 | bge-base | 0.685 | 0.597 | 0.088 | 0.873 | 0.974 |
| 6 | bioformer-8l | 0.806 | 0.738 | 0.067 | 0.917 | 0.983 |
| 7 | e5-base-v2 | 0.823 | 0.771 | 0.052 | 0.936 | 0.985 |
| 8 | medcpt-query | 0.786 | 0.735 | 0.051 | 0.938 | 0.951 |
| 9 | scibert | 0.828 | 0.783 | 0.045 | 0.945 | 0.984 |
| 10 | specter2 | 0.876 | 0.834 | 0.043 | 0.951 | 0.979 |
| 11 | embeddinggemma-prescribed | 0.845 | 0.806 | 0.039 | 0.953 | 0.981 |
| 12 | embeddinggemma | 0.879 | 0.853 | 0.026 | 0.970 | 0.968 |
| 13 | clinicalbert | 0.906 | 0.880 | 0.026 | 0.972 | 0.960 |
| 14 | biomedbert-abstract | 0.968 | 0.956 | 0.012 | 0.988 | 0.979 |
| 15 | biomedbert-fulltext | 0.979 | 0.971 | 0.007 | 0.992 | 0.969 |
The story this table tells if you stop here:
MiniLM is still 1.7x better than the runner-up, five modern general-purpose contrastive encoders own the top five slots regardless of size (22M-273M), the contrastive-biomedical encoder MedCPT slots awkwardly in the middle (#8) alongside E5, and BiomedBERT is broken — ship MiniLM.
The story that's more interesting is adding the topology layer inverts most of this ranking.
What the centroid heatmap shows
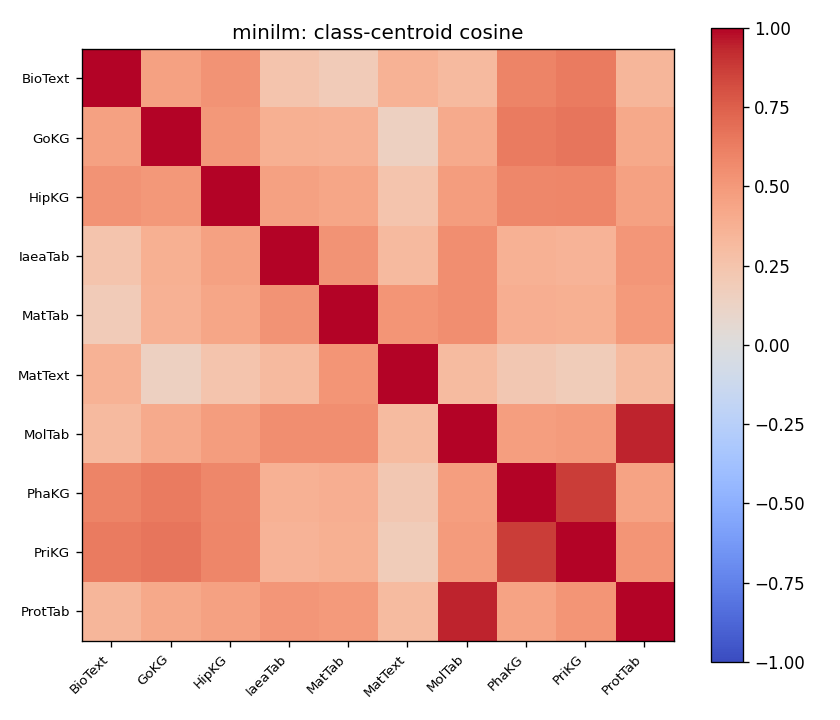
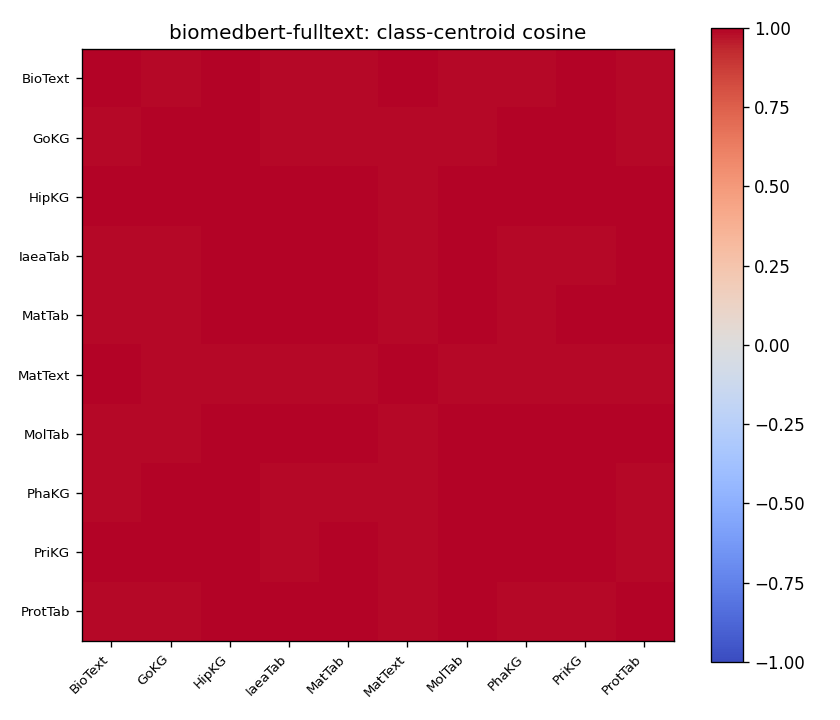
"Class-centroid pairwise cosine on SciCUEval. Top: MiniLM — diagonal block clearly separated from off-diagonal. Bottom: BiomedBERT-fulltext — entire matrix saturated near 1.0; centroids are mutually indistinguishable in this view."
For MiniLM, the diagonal block (within-class) is more red than the off-diagonal (between-class), so there's an underlying geometric structure there to exploit. For BiomedBERT-fulltext, every cell is saturated near 1.0. Looking only at this cosine matrix, you'd conclude the embedder has no useful information in its embeddings pertaining to subject class.
But I think that's where the within/between histograms start to shape a different story:
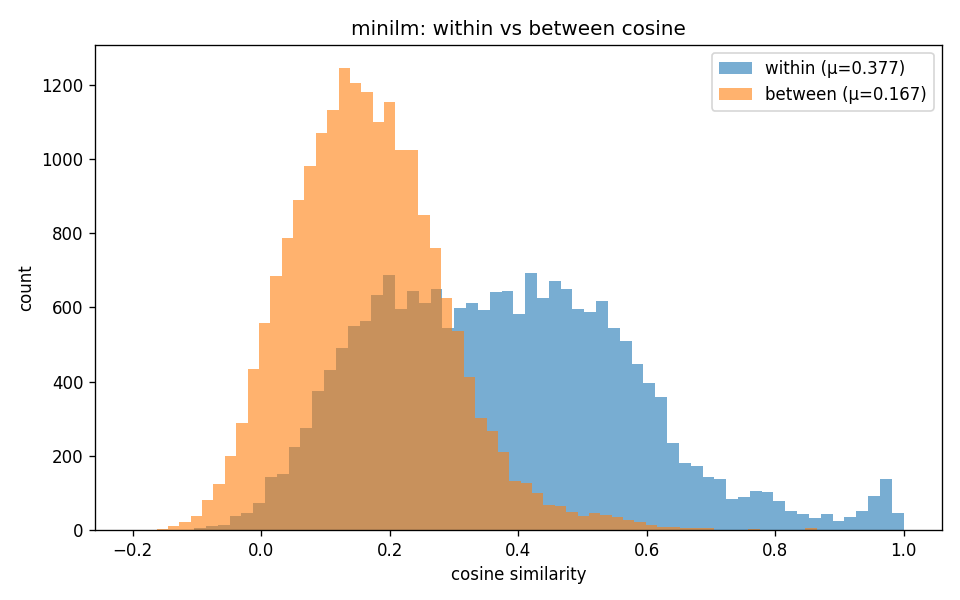
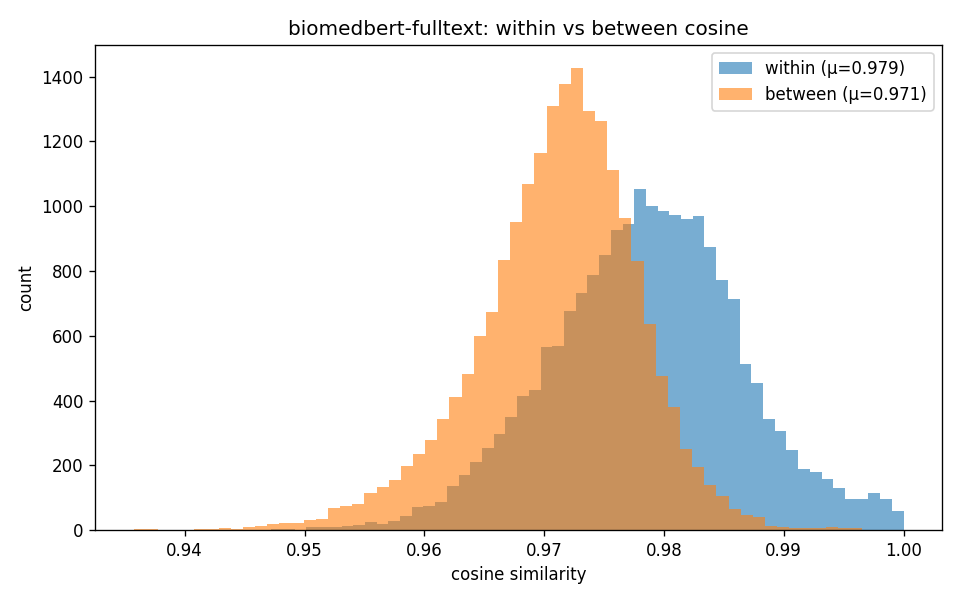
"Within-class (orange) vs between-class (blue) cosine distributions. MiniLM's two distributions barely overlap. BiomedBERT-fulltext's distributions are nearly identical, but a 0.008 mean shift on rank-ordered local neighborhoods is still enough for downstream classifiers and for Mapper to find structure (see Layer 2 in the flow diagram)."
The within/between cosine distributions overlap heavily for BiomedBERT-fulltext, but they're not identical. A 0.008 mean shift in cosine looks like nothing on the heatmap, but it's preserved as a rank order of nearest neighbors, and rank order is what Mapper and HDBSCAN (Hierarchical Density-Based Spatial Clustering of Applications with Noise) actually probe.
The logistic (LR) accuracy trap
Logistic regression (LR) accuracy on raw embeddings (last column of the cosine table) sits in 0.95-0.99 across all 14 encoders. By the coarsest metric, every encoder is roughly equivalent. This is the signal that makes cosine bake-offs misleading. In a 768-dim space, you can almost always draw a flat boundary that separates one labeled subset from another, even if the points are packed into a tight blob. So 'logistic regression got 98%' tells you the points are labelable, not that the embedding has useful geometry. The downstream classifier looks fine. The cosine + LR view of these models is brittle: both metrics can look healthy even when the underlying geometry has collapsed. The topology layer of analysis lets us poke around each embedder's output-layer geometry.
Layer 2: TDA / Mapper Stability, And Why It Disagrees With Cosine
What Mapper does
Mapper is a topological data analysis algorithm. The mapper algorithm takes a high-dimensional point cloud, projects it through a "lens" (here: 2D UMAP), covers the lens range with overlapping cubes, and clusters within each cube using a precomputed distance matrix (here: cosine distance on the original embeddings). It then builds a graph where nodes are clusters and edges connect clusters that share documents. The output is a graph that captures local topological structure that pure dimensionality reduction would flatten. For example, a 2D circle (one loop, no enclosed volume) and a 2D filled disk (no loop, enclosed volume) project to similar 2D scatter plots, but Mapper distinguishes them — the circle's graph has a cycle, the disk's doesn't. Conversely, a donut and a coffee cup are topologically equivalent (both have one hole / genus 1). Both would yield the same Mapper graph, both with a cycle, which is the correct outcome.
The catch for these experiments: Mapper is sensitive to UMAP's randomness. A single UMAP fit gives you one possible projection out of many. The fix, which I've taken straight from the 2025 "When Annotators Disagree" paper, is to run Mapper across many UMAP seeds (I used 25) and measure stability via:
- Statistic-level stability: coefficient of variation across seeds on graph statistics (n_nodes, n_edges, b1, etc.).
- Partition-level stability: pairwise Adjusted Rand Index (ARI) and Normalized Mutual Information (NMI) on document-to-node assignments across the seed set.
TDA results on SciCUEval
Sorted by mean_ari (topological stability across 25 UMAP seeds):
| encoder | ARI | NMI | weighted purity | anchor ρ | coverage | nodes | comps |
|---|---|---|---|---|---|---|---|
medcpt-query | 0.864 | 0.967 | 0.957 | 0.532 | 0.397 | 173 | 82 |
bioformer-8l | 0.840 | 0.963 | 0.963 | 0.234 | 0.565 | 197 | 97 |
scibert | 0.834 | 0.964 | 0.941 | 0.270 | 0.611 | 207 | 102 |
biomedbert-abstract | 0.829 | 0.963 | 0.965 | 0.248 | 0.503 | 200 | 100 |
embeddinggemma-prescribed | 0.821 | 0.962 | 0.853 | 0.151 | 0.616 | 231 | 112 |
biomedbert-fulltext | 0.818 | 0.962 | 0.941 | 0.249 | 0.536 | 204 | 101 |
embeddinggemma (naive) | 0.791 | 0.948 | 0.945 | 0.311 | 0.442 | 146 | 69 |
bge-base | 0.766 | 0.945 | 0.957 | 0.195 | 0.496 | 155 | 74 |
clinicalbert | 0.760 | 0.952 | 0.960 | 0.246 | 0.549 | 195 | 94 |
minilm | 0.757 | 0.950 | 0.966 | 0.059 | 0.468 | 184 | 86 |
specter2 | 0.756 | 0.950 | 0.971 | 0.243 | 0.561 | 183 | 91 |
bge-small | 0.741 | 0.941 | 0.933 | 0.351 | 0.483 | 160 | 73 |
e5-base-v2 | 0.738 | 0.943 | 0.942 | 0.077 | 0.512 | 170 | 80 |
arctic-embed-m | 0.710 | 0.943 | 0.902 | 0.492 | 0.474 | 168 | 81 |
nomic-embed-v1.5 | 0.673 | 0.929 | 0.906 | 0.340 | 0.534 | 171 | 79 |
The ranking flips. Five of the six top-ARI rows are biomedical MLM encoders, the same encoders that occupied ranks 9-15 on cosine.
biomedbert-fulltext, near-dead-last on cosine, lands at weighted class purity 0.941.
Meaning, its Mapper graph carves a clean categorical structure the cosine view failed to separate.
medcpt-query is the only encoder in the roster in the top two on both stability and anchor faithfulness.
The headline finding: MedCPT wins continuous-anchor faithfulness
The contrastive + biomedical cell of the 2x2 matrix turns out to be the cell that wins the anchor-faithfulness axis in the topological testing.
medcpt-query (NCBI's PubMed-search encoder, contrastive-trained on real user click logs) hits anchor Spearman ρ = 0.532 on SciCUEval.
This beats arctic-embed-m (0.492) and is almost an order of magnitude above minilm's 0.059.
The training-regime taxonomy reads as:
| low anchor ρ (training scrubs surface features) | high anchor ρ (manifold tracks textstat) | |
|---|---|---|
| General-purpose contrastive | minilm (0.059), e5-base-v2 (0.077) | arctic-embed-m (0.492), bge-small (0.351), nomic (0.340) |
| Biomedical contrastive | — | medcpt-query (0.532) |
| Biomedical MLM | — | scibert (0.270), bioformer-8l (0.234), biomedbert (0.248-0.249), clinicalbert (0.246), specter2 (0.243) |
Contrastive training usually pushes pairs apart by semantic similarity and treats surface features as adversarial noise. That may be why MiniLM's anchor ρ collapses to 0.059. It also explains why MedCPT's contrastive signal is different. PubMed-search query/article pairs from real user logs already encode the surface-feature gradient (biomedical search behavior correlates with vocabulary difficulty, sentence length, syllable density). Train on that signal and the output manifold inherits the correlation. The textstat coupling survives because it was in the training data, not in spite of it.
The MMLU contrast run answers whether MedCPT's anchor faithfulness generalizes to off-domain text corpora. It does not. The collapse turns out to be the most dramatic single result in the entire run.
How stable is "stable"?
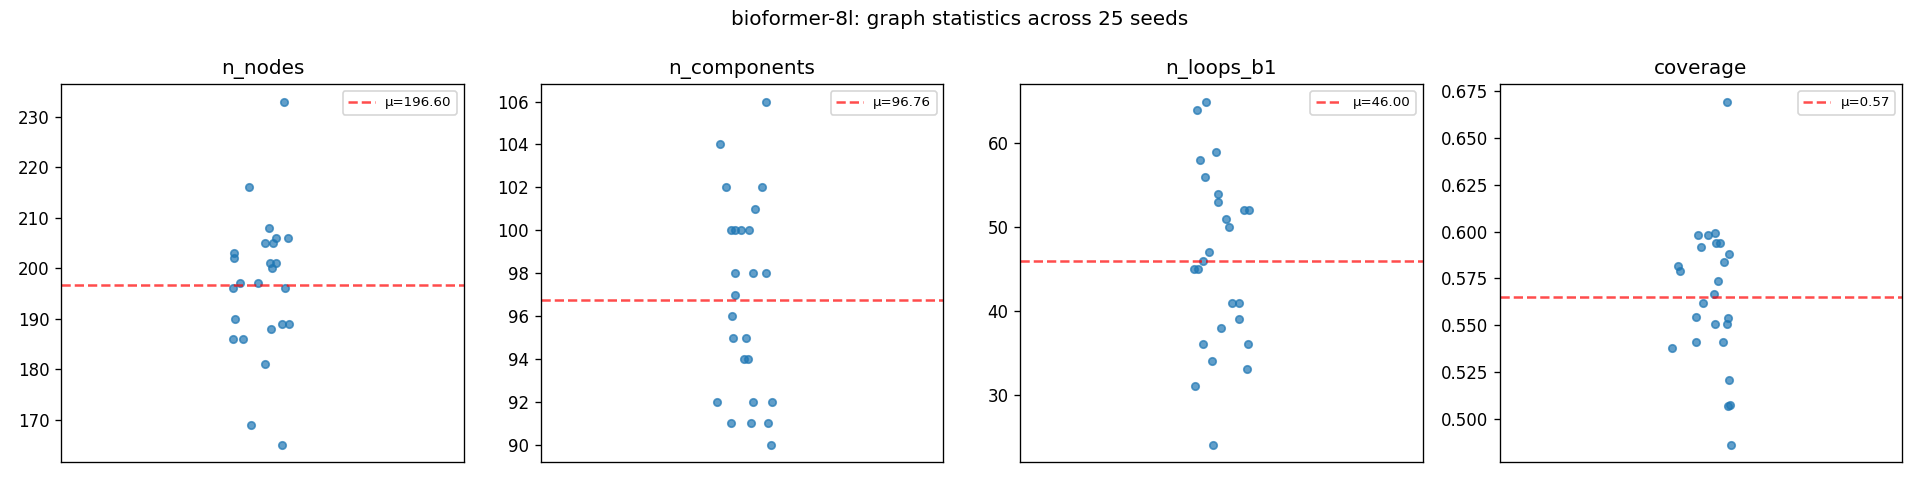
Bioformer-8L's Mapper graph statistics across 25 UMAP seeds. n_nodes, n_components, b1, and coverage all cluster tightly around the mean (red dashed line). This is what 'topologically stable' looks like; UMAP's randomness shifts the 2D projection but not the graph structure underneath.
An ARI of 0.840 means that across 25 different UMAP seeds, the same documents end up in the same Mapper-graph nodes 84% above chance. Combined with the strip plot showing graph statistics (node count, connected components, b₁, coverage) barely moving, both partition-level and statistic-level stability hold. The topology is a property of the embedding model's output manifold, which is the surface in high-dimensional space where its output embeddings actually live.
Pulling It All Together
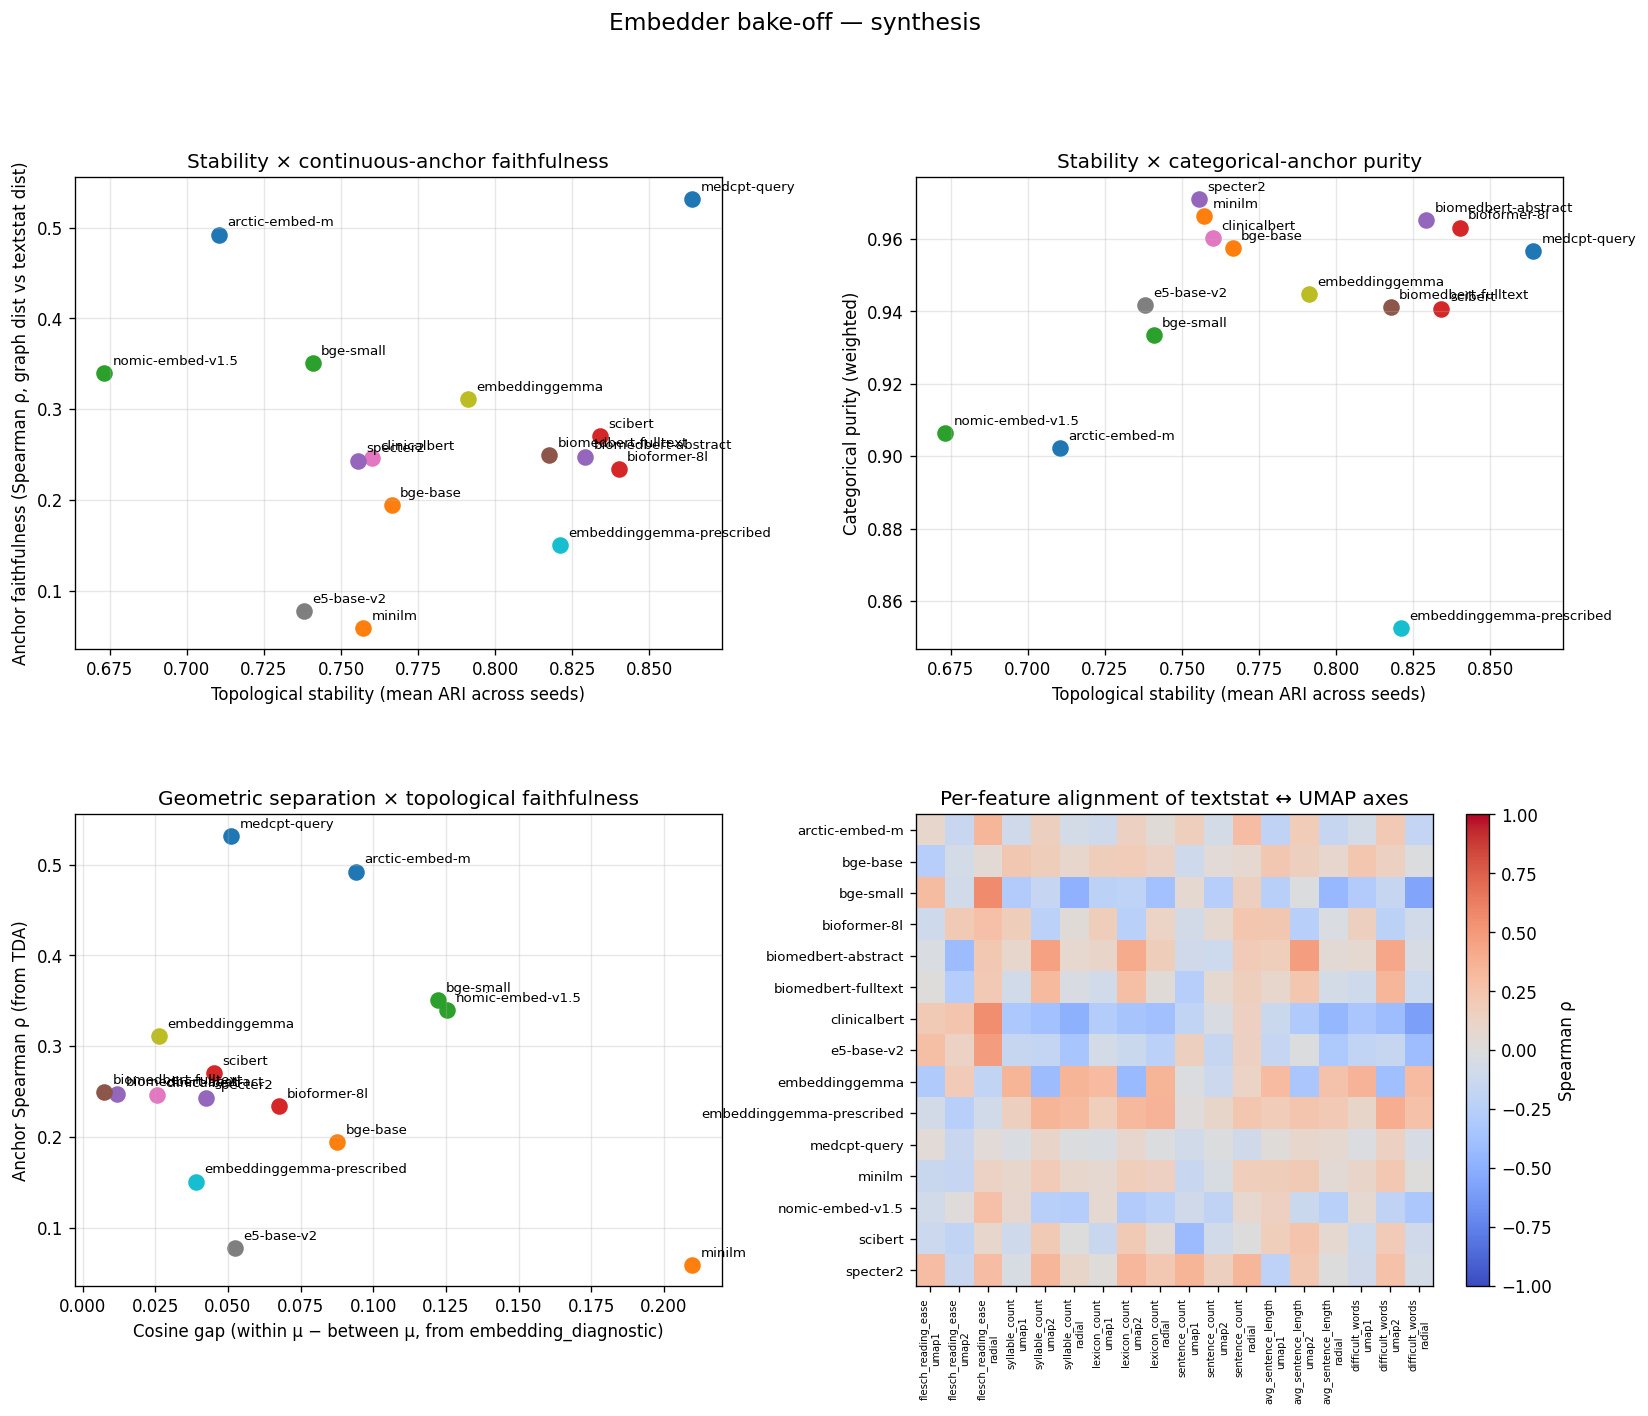
All four diagnostic views across the 15-row roster on SciCUEval. (Upper-left) Stability vs anchor faithfulness —
medcpt-queryis the upper-right outlier. (Upper-right) Stability vs categorical purity → most encoders cluster top-right; the spread is on the x-axis. (Lower-left) Cosine gap (Layer 1) vs anchor Spearman ρ (Layer 3) → anti-correlated: encoders that spread embeddings most are the ones whose manifolds least track surface features. (Lower-right) Per-feature alignment heatmap: rows are encoders, columns are textstat features x (umap1, umap2, radial)."
If you only looked at one figure for SciCUEval, this is it.
The lower-left panel is the punchline: cosine gap and anchor ρ are anti-correlated. Encoders that score well on standard cosine bake-offs are the ones whose output geometry bears the weakest relationship to linguistic surface features.
Layer 3: Linguistic Anchors As Ground Truth
I used the six textstat features (Flesch reading ease, syllable count, lexicon count, sentence count, average sentence length, difficult words) as continuous linguistic anchors. Spearman ρ is a rank correlation: ρ = 1 means closer-in-the-Mapper-graph pairs are also closer in textstat space and in the same rank order; ρ = 0 means no relationship; ρ = -1 means rank-reversed. Unlike Pearson correlation, it doesn't assume the relationship is linear. "Graph distance" is the shortest-path edge count between the two pairs' Mapper nodes. The Spearman ρ in the table above is between graph distance in the Mapper graph and Euclidean distance in standardized textstat space, on a sample of 5,000 document pairs.
Per-feature alignment heatmap
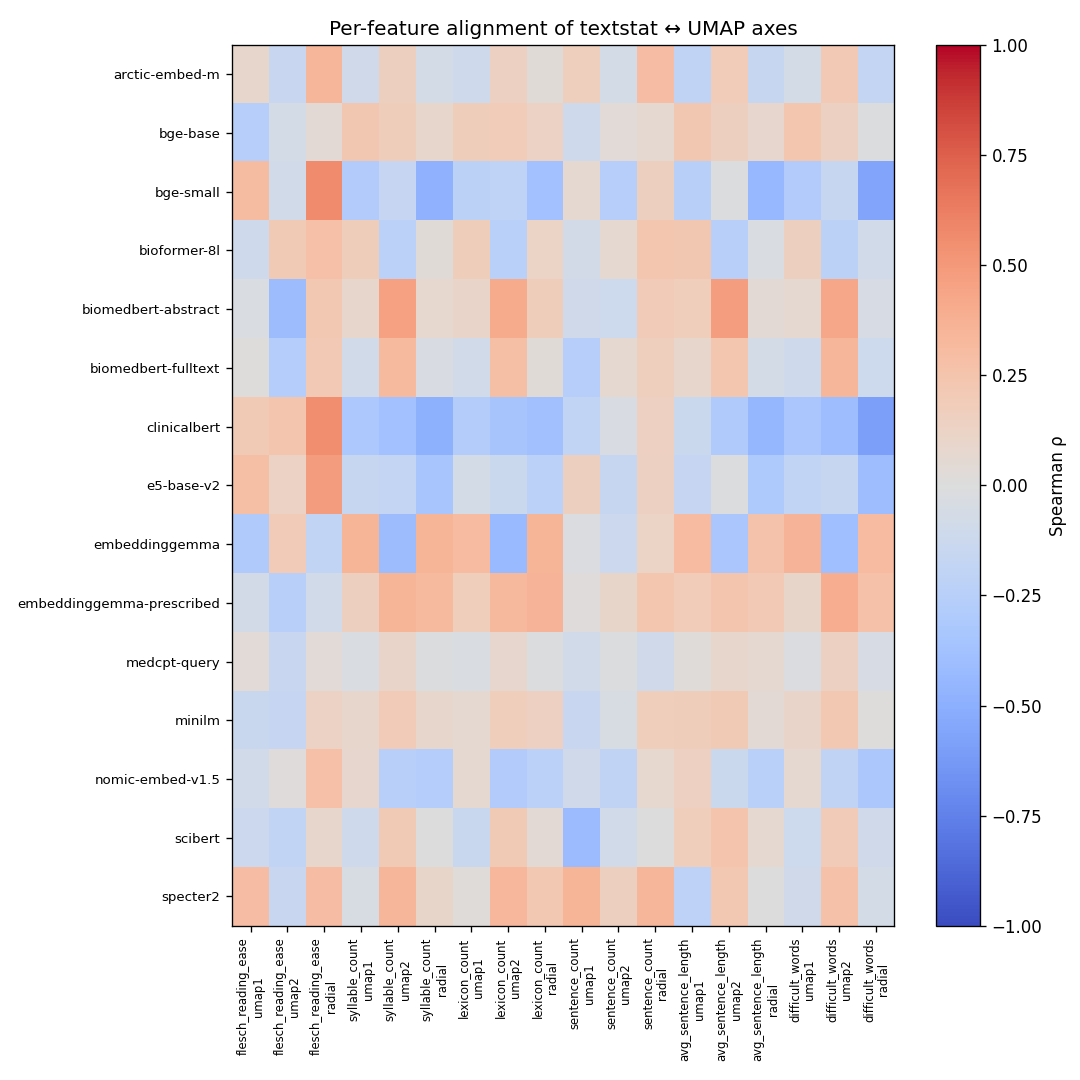
Spearman ρ between each textstat feature and each UMAP axis (umap1 / umap2 / radial), per encoder. Cells are colored coolwarm: blue = anti-correlated, red = correlated. The pattern: arctic-embed-m and bge-small show the strongest gradients; minilm rows are pale, indicating no consistent surface-feature structure."
Interesting findings:
arctic-embed-mhas visible non-zero structure — its training on web query-document pairs preserves length/readability gradients as a noise floor that didn't get scrubbed out.minilmis the palest heatmap row — its supervised InfoNCE contrastive training (InfoNCE pulls semantic 'positives' together, pushes the rest apart) treats surface features as adversarial noise. The result: clean clusters by topic, gradient-flat by surface form. ρ = 0.059 across the whole graph distance.biomedbert-fulltexthas more structure than abstract-only BiomedBERT, presumably from full-text pretraining exposing the model to more stylistic variation than abstract-only data.
This final layer makes "MiniLM wins cosine" a less interesting result. MiniLM wins cosine because that's what it was trained to do. The interesting question is whether anything else about the embedding space survives that training.
The Contrast Run: MMLU Non-STEM
The single-corpus story above is suggestive but not conclusive. You might be thinking, "you're seeing this on biomedical text because the BiomedBERT and MedCPT models have a built-in advantage there." Fair point. I re-ran the entire pipeline. The same 14 encoders, same Mapper config, same textstat anchors were used with the MMLU non-STEM corpus. This consisted of ten general-knowledge subjects across humanities, social science, law/policy, business, and common knowledge.
If the cosine vs. topology disagreement is a property of biomedical text specifically, it should disappear here. If it's a property of the embedding methodology, it should persist with different encoder rankings.
What stayed the same
The cosine ranking is near-identical to SciCUEval's:
- MiniLM comes out on top by 1.5x on cosine gap (0.120 vs 0.080 for runner-up).
- The five general-purpose modern encoders (minilm, bge-small, bge-base, arctic-embed-m, nomic-embed-v1.5) take the top five slots.
- Both BiomedBERT variants are dead last (gaps 0.011 and 0.006 — almost the same numbers as on SciCUEval).
- Logistic regression accuracy drops to 0.77-0.87 on MMLU but the ordering of encoders barely changes.
So the cosine ranking measures something about the encoders, not necessarily about the corpus. Or, more succinctly: how aggressively did the training objective push pairs apart?
What flipped
The TDA layer rankings reorganized. Stability and anchor-faithfulness deltas across all 14 encoders (15 evaluation rows; EmbeddingGemma is counted twice):
| encoder | ARI sci → mmlu | Δ ARI | purity sci → mmlu | Δ purity | anchor ρ sci → mmlu | Δ ρ |
|---|---|---|---|---|---|---|
bge-base | 0.766 → 0.880 | +0.114 | 0.957 → 0.953 | -0.004 | 0.195 → -0.052 | -0.247 |
bge-small | 0.741 → 0.862 | +0.121 | 0.933 → 0.936 | +0.003 | 0.351 → 0.151 | -0.200 |
biomedbert-abstract | 0.829 → 0.842 | +0.013 | 0.965 → 0.882 | -0.083 | 0.248 → 0.050 | -0.198 |
bioformer-8l | 0.840 → 0.837 | -0.003 | 0.963 → 0.975 | +0.012 | 0.234 → 0.204 | -0.030 |
nomic-embed-v1.5 | 0.673 → 0.834 | +0.161 | 0.906 → 0.936 | +0.030 | 0.340 → 0.180 | -0.160 |
e5-base-v2 | 0.738 → 0.832 | +0.094 | 0.942 → 0.925 | -0.017 | 0.077 → 0.034 | -0.043 |
embeddinggemma (naive) | 0.791 → 0.823 | +0.032 | 0.945 → 0.907 | -0.038 | 0.311 → 0.151 | -0.160 |
minilm | 0.757 → 0.822 | +0.065 | 0.966 → 0.908 | -0.058 | 0.059 → 0.006 | -0.053 |
arctic-embed-m | 0.710 → 0.802 | +0.092 | 0.902 → 0.847 | -0.055 | 0.492 → 0.193 | -0.299 |
clinicalbert | 0.760 → 0.772 | +0.012 | 0.960 → 0.807 | -0.153 | 0.246 → 0.059 | -0.187 |
scibert | 0.834 → 0.749 | -0.085 | 0.941 → 0.737 | -0.204 | 0.270 → -0.020 | -0.290 |
specter2 | 0.756 → 0.704 | -0.052 | 0.971 → 0.817 | -0.154 | 0.243 → 0.030 | -0.213 |
embeddinggemma-prescribed | 0.821 → 0.704 | -0.117 | 0.853 → 0.784 | -0.069 | 0.151 → 0.039 | -0.112 |
biomedbert-fulltext | 0.818 → 0.695 | -0.123 | 0.941 → 0.808 | -0.133 | 0.249 → 0.476 | +0.227 |
medcpt-query | 0.864 → 0.962 | +0.098 | 0.957 → 0.804 | -0.153 | 0.532 → 0.000 | -0.532 |
MedCPT's MMLU ARI is in italics because it's an artifact, not a finding — see the next section.
Emergent MMLU Patterns:
General-purpose modern encoders gained stability on MMLU.
bge-base overtook bioformer-8l at the top.
Their training distribution overlaps MMLU more than SciCUEval, so the output becomes more reproducible across UMAP seeds while doing topological analysis.
nomic-embed-v1.5 and e5-base-v2 follow the same pattern.
bioformer-8l is again the only encoder that held steady on all three metrics across corpora.
Stability flat, purity up by 0.012 (now the highest weighted purity on the entire MMLU run), anchor ρ down only 0.030.
Its biomedical pretraining produces an output so well-defined that it organizes out-of-domain prompts coherently, likely for the wrong reasons.
One possible explanation is, despite its over-specialization, the the smaller 8L PubMed-only encoder falls back on broad lexical/length cues for non-medical text.
scibert, specter2, embeddinggemma-prescribed, and the BiomedBERT pair lost stability + purity on MMLU.
Intermediate-domain training (SciBERT, SPECTER2) is the most brittle.
There's enough signal to organize scientific text, not enough to find structure when the corpus shifts.
clinicalbert lost the second-most purity (-0.153).
Its MIMIC-clinical training is the furthest from MMLU's general-knowledge MCQs, and the output layer reflects that.
embeddinggemma-prescribed flipped relative to naive on MMLU.
On SciCUEval the prescribed prefix was a stability win (ARI 0.821 vs 0.791).
On MMLU the prescribed prefix is a stability loss (0.704 vs 0.823).
The task: classification | query: framing is corpus-shape-dependent; MMLU's short prompts don't fit its assumption.
The single most-interesting result: two opposite failure modes for domain-trained encoders
The bottom two rows of the cross-corpus table tell the cleanest mechanistic story from the experiments. Both encoders are domain-pretrained on PubMed content and both are asked to embed philosophy and law-school questions. They fail in completely different ways.
biomedbert-fulltext (MLM-domain) anchor ρ went 0.249 → 0.476.
A PubMed-only MLM encoder has no biomedical content signal in MMLU prompts.
However, it appears its masked-language-model training preserved local linguistic structure as a byproduct.
So the manifold falls back on those surface features; the textstat coupling jumps.
medcpt-query (contrastive-domain) anchor ρ went 0.532 → 0.000.
Contrastive training is built to scrub surface features.
InfoNCE explicitly maximizes semantic-pair similarity, treating surface gradients as adversarial.
With no content signal and no surface-feature fallback, MedCPT's manifold simply disintegrates.
The mean Mapper node count drops from 173 to 1.84, coverage from 0.40 to 0.006, and almost the entire 2,450-prompt MMLU corpus lands in HDBSCAN's outlier pool.
The 0.962 ARI is an artifact of partitioning ~1 cluster into ~1 cluster across all 25 seeds, not a finding.
Same thesis, opposite directions, mechanistically predicted by training objective. MLM domain-pretrained models keep a latent surface-feature gradient as scaffolding; contrastive domain-pretrained models train against it. InfoNCE rewards invariance to anything that doesn't separate semantic pairs, and over many gradient steps that gradient gets squeezed out of the manifold. When the content signal vanishes, the MLMs fall back on surface features and the contrastive models fall through them. Training regime is destiny, not as a slogan but as a prediction about which encoders fail in which ways under domain shift.
MMLU synthesis figure
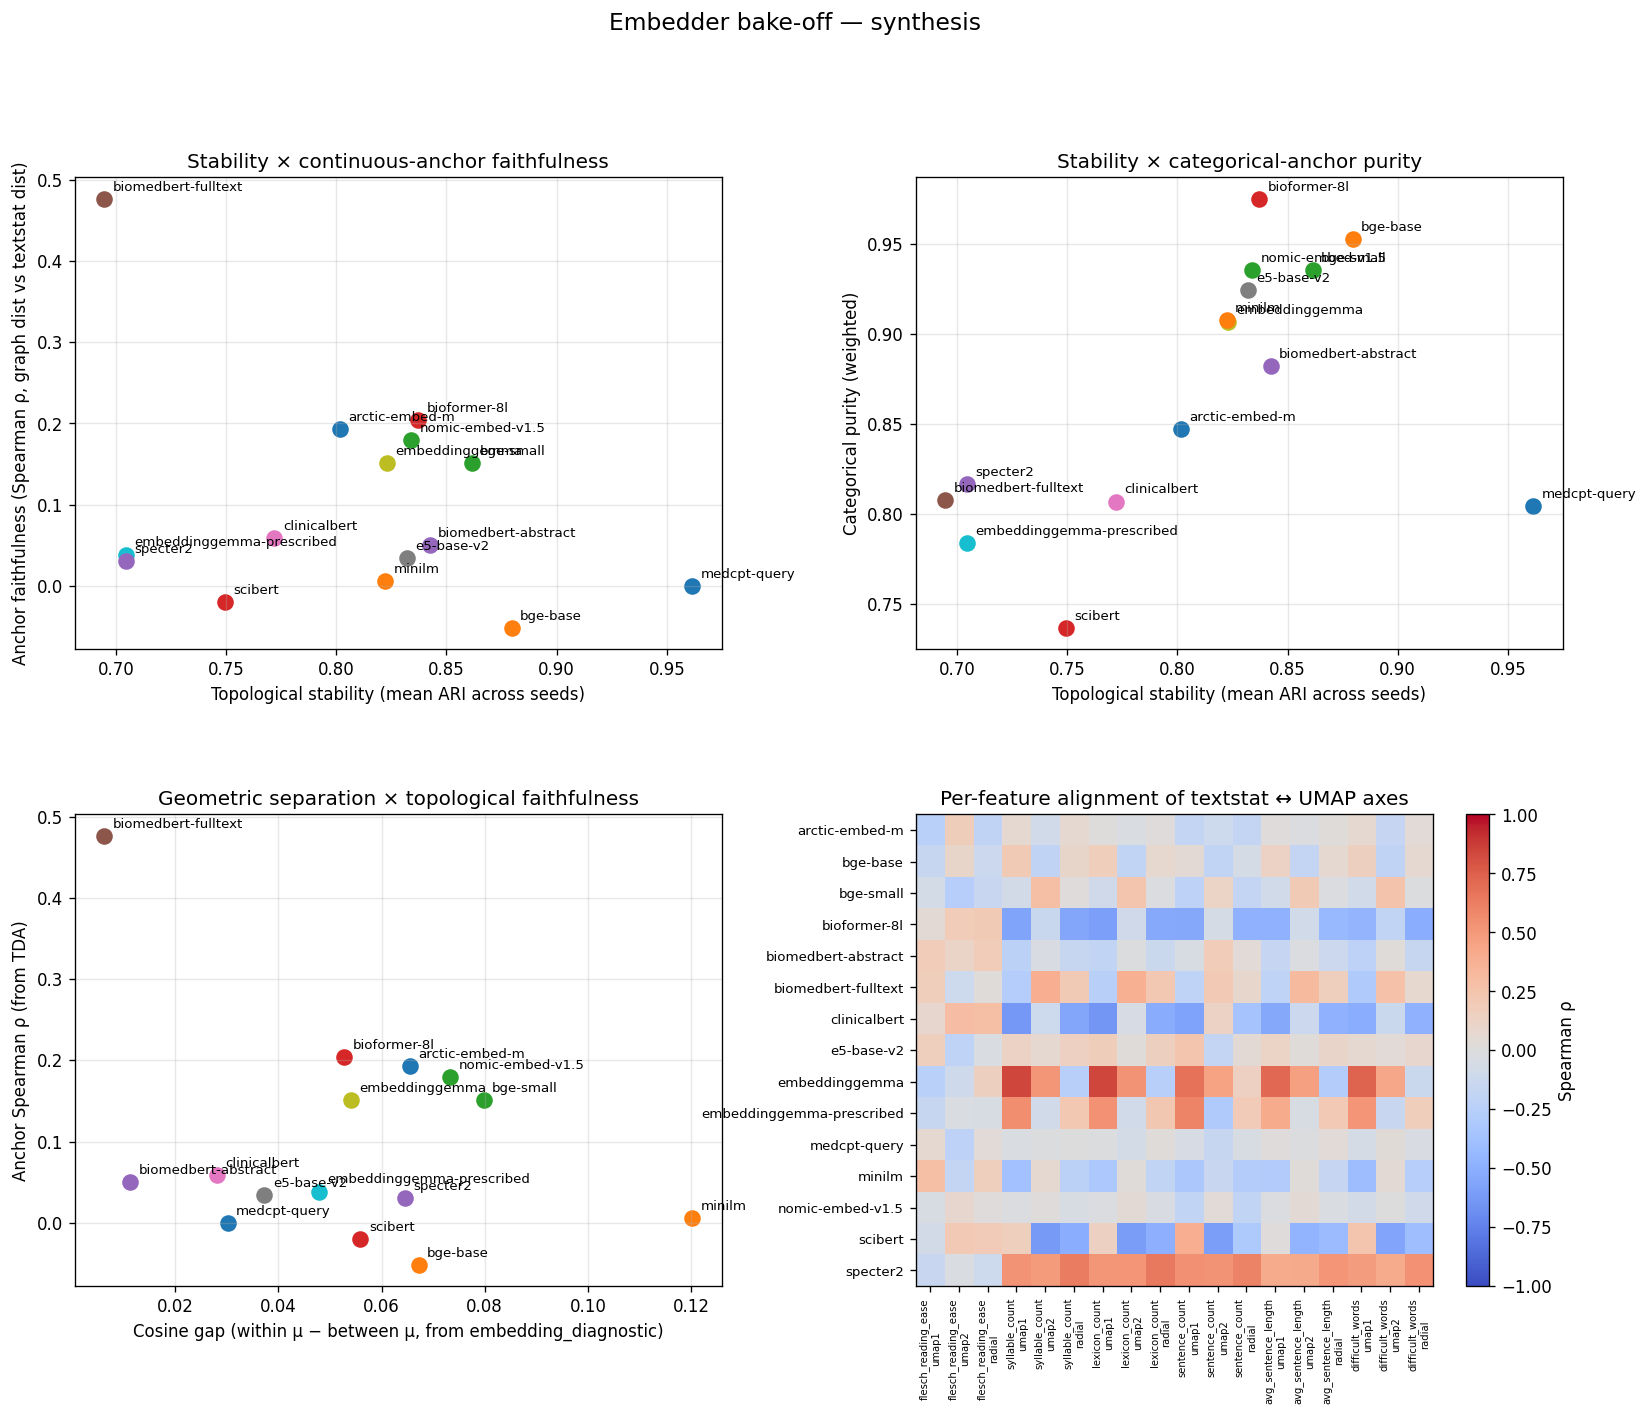
Same four panels as the SciCUEval synthesis, on MMLU non-STEM. Two outlier points are worth tracing manually: (a) biomedbert-fulltext has the highest anchor ρ on this corpus (0.476) — the surface-feature fallback. (b) medcpt-query has anchor ρ ≈ 0 with mean node count 1.84. The Pareto frontier looks completely different from SciCUEval after the corpus shift.
Architecture vs Training
The roster contains nine BERT-base-architecture encoders (biomedbert-abstract, biomedbert-fulltext, scibert, clinicalbert, medcpt-query, bge-base, arctic-embed-m, e5-base-v2, specter2).
They differ in pretraining era by 5-6 years and in training objective by entire paradigms.
Some use masked language modeling on one corpus, contrastive on another, retrieval on a third, citation-graph contrastive on a fourth, click-log contrastive on a fifth.
On the MMLU stability ranking:
bge-base(BERT-base, 2024, contrastive on web pairs): #1, ARI 0.880scibert(BERT-base, 2019, MLM on scientific corpus): #11, ARI 0.749
Same starting architecture. Five years apart in pretraining era. Opposite ends of the ranking. The 14-encoder roster sharpens this further. The four-cell training-regime taxonomy (general/biomedical x contrastive/MLM) doesn't just predict where each encoder falls on cosine; it predicts the axis on which it does best.
- Modern general-purpose contrastive encoders dominate cosine geometry but score low on continuous-anchor faithfulness. Their training scrubbed surface features.
- Biomedical MLM encoders collapse on cosine geometry but recover stable, categorically clean Mapper graphs. Their masked-language training preserved local neighborhood structure that cosine integration over the whole space can't see.
- The biomedical-contrastive encoder (MedCPT) wins continuous-anchor faithfulness — a result no general-purpose model on the roster comes close to.
- General-purpose MLM encoders are an empty cell by design; bare BERT isn't an embedding model.
The MTEB leaderboards reward training objective alignment with their fixed benchmark suite. A topology-aware bake-off reveals more information about what the encoder was trained on, how it was trained, and how well your corpus overlaps with that training. TLDR: You cannot pick an embedder by reading any single benchmark column.
Visual: Same Encoder, Two Corpora
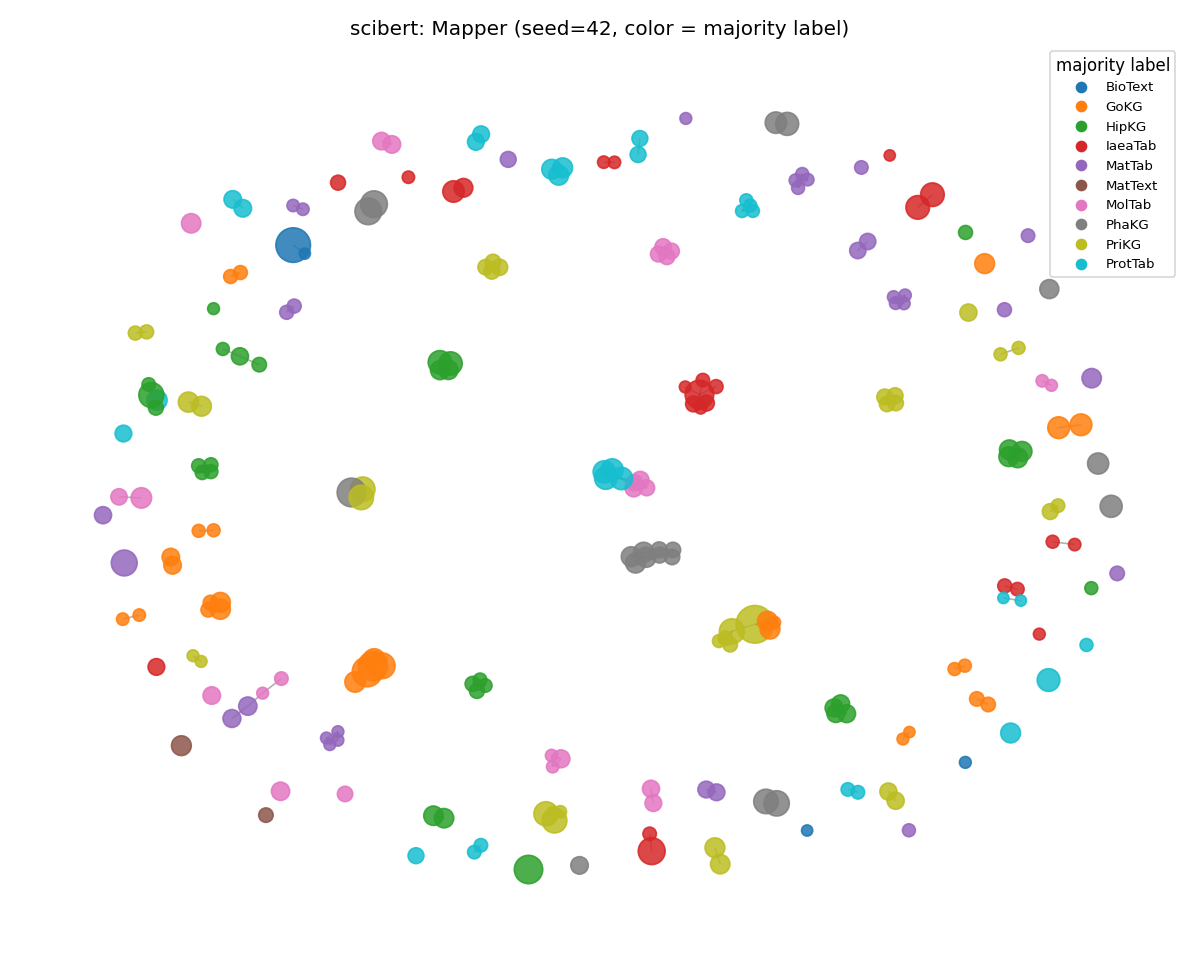
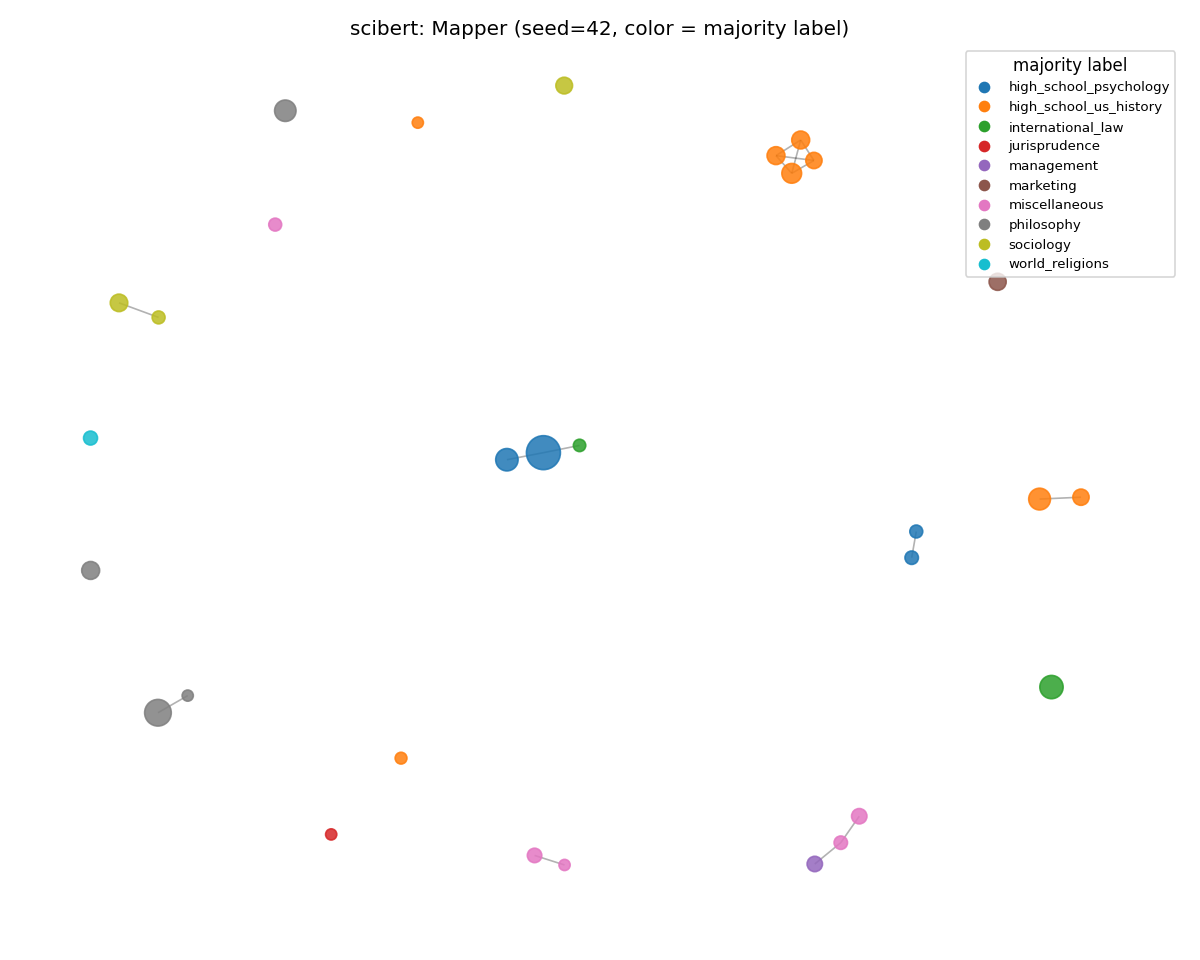
The clearest cross-corpus evidence is in the static Mapper graphs. Spring layout, node size proportional to membership, node color = majority subject label.
medcpt-query (disintegrated)
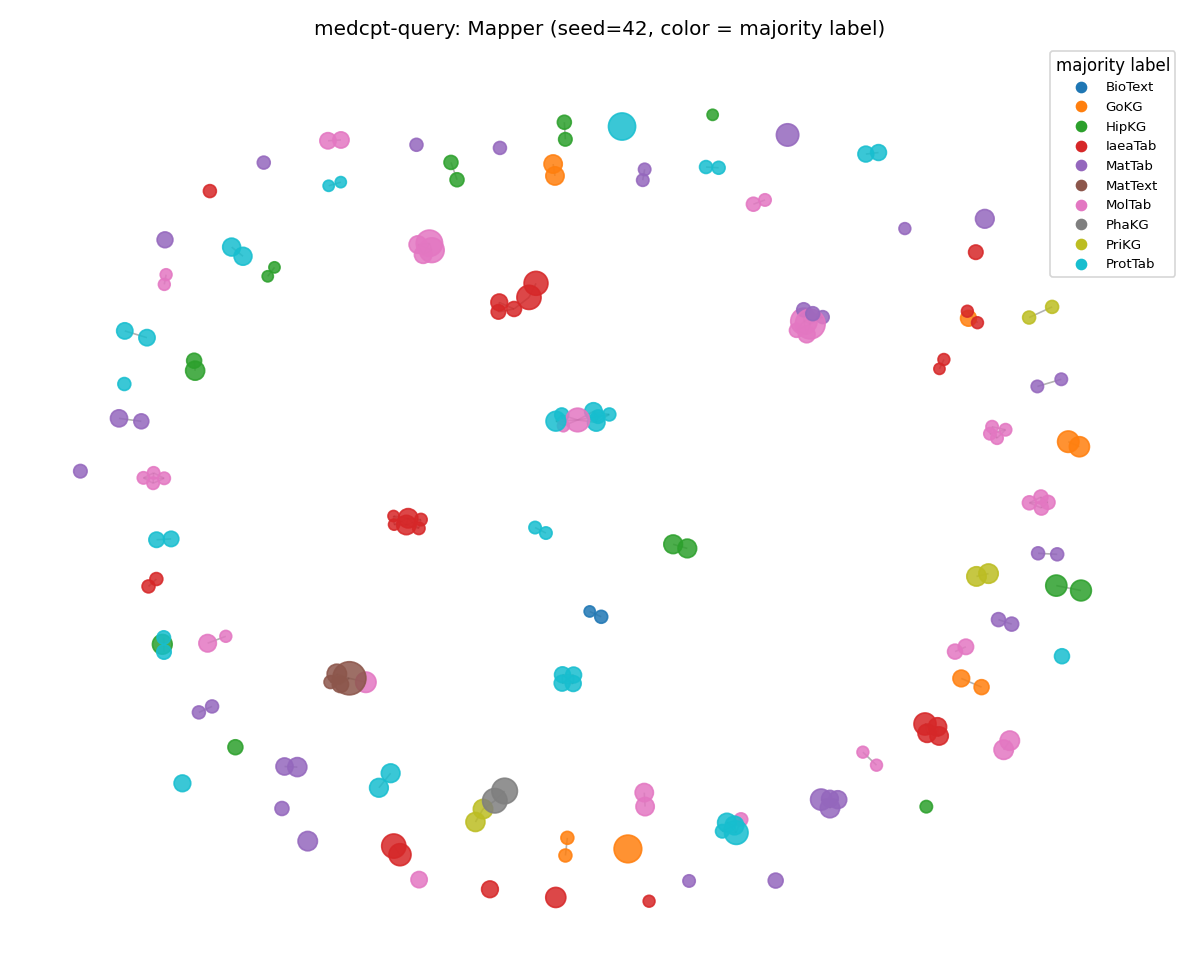
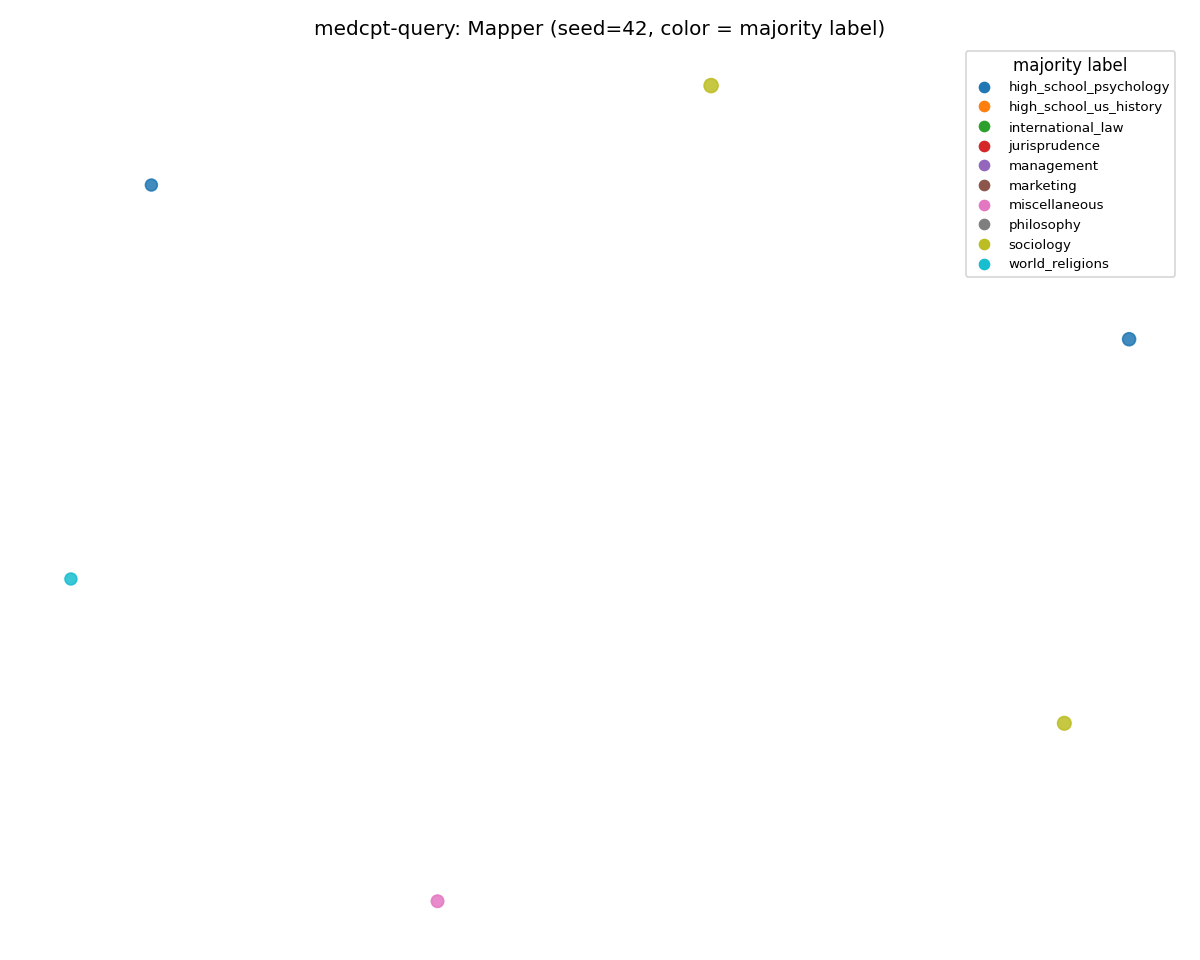
SciCUEval: 173 nodes, structured manifold. MMLU: ~2 nodes — the rest of the corpus is in HDBSCAN's outlier pool.
Same encoder, same Mapper config, same prompts-per-class budget. The only difference is the corpus the encoder is reading.
biomedbert-fulltext (fell back on surface features)
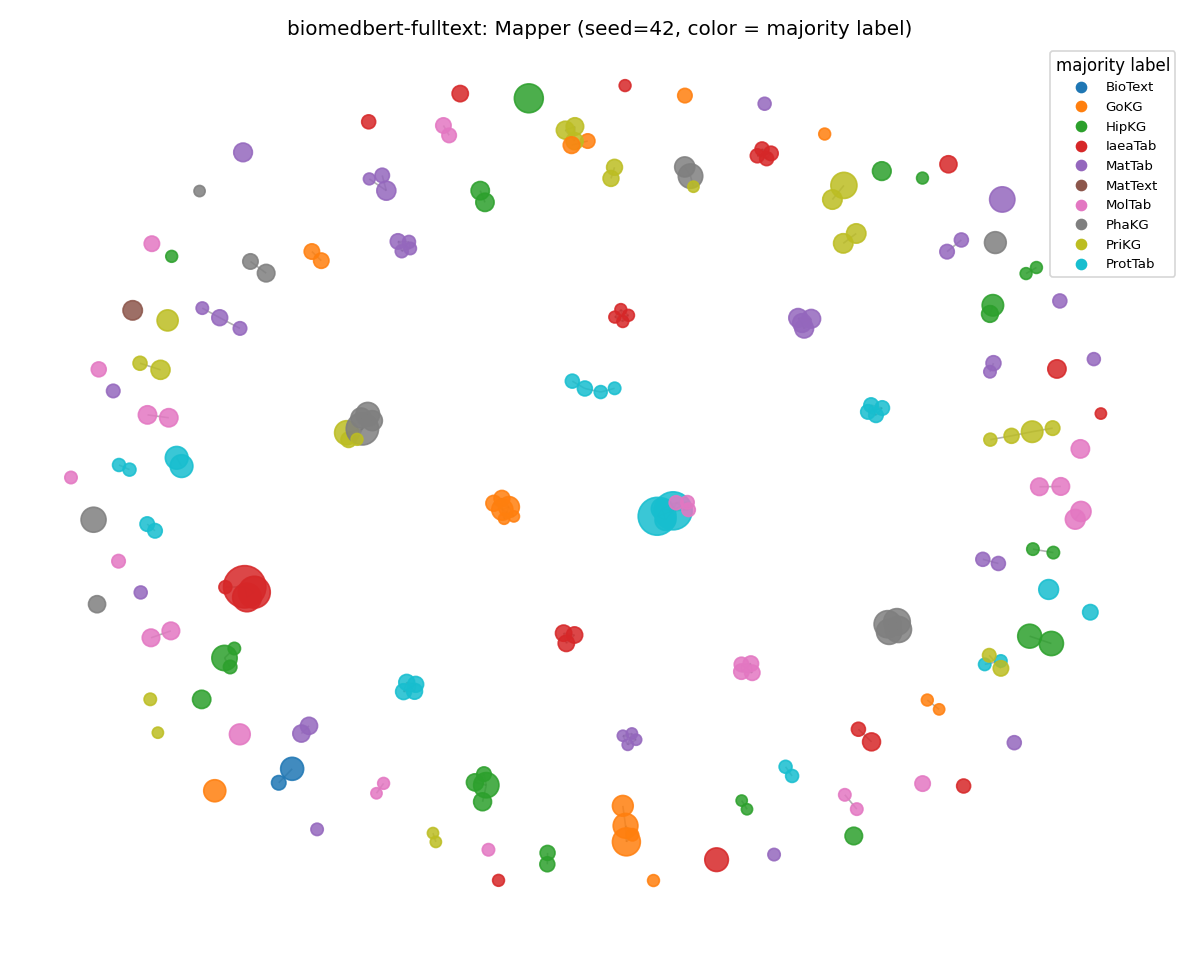
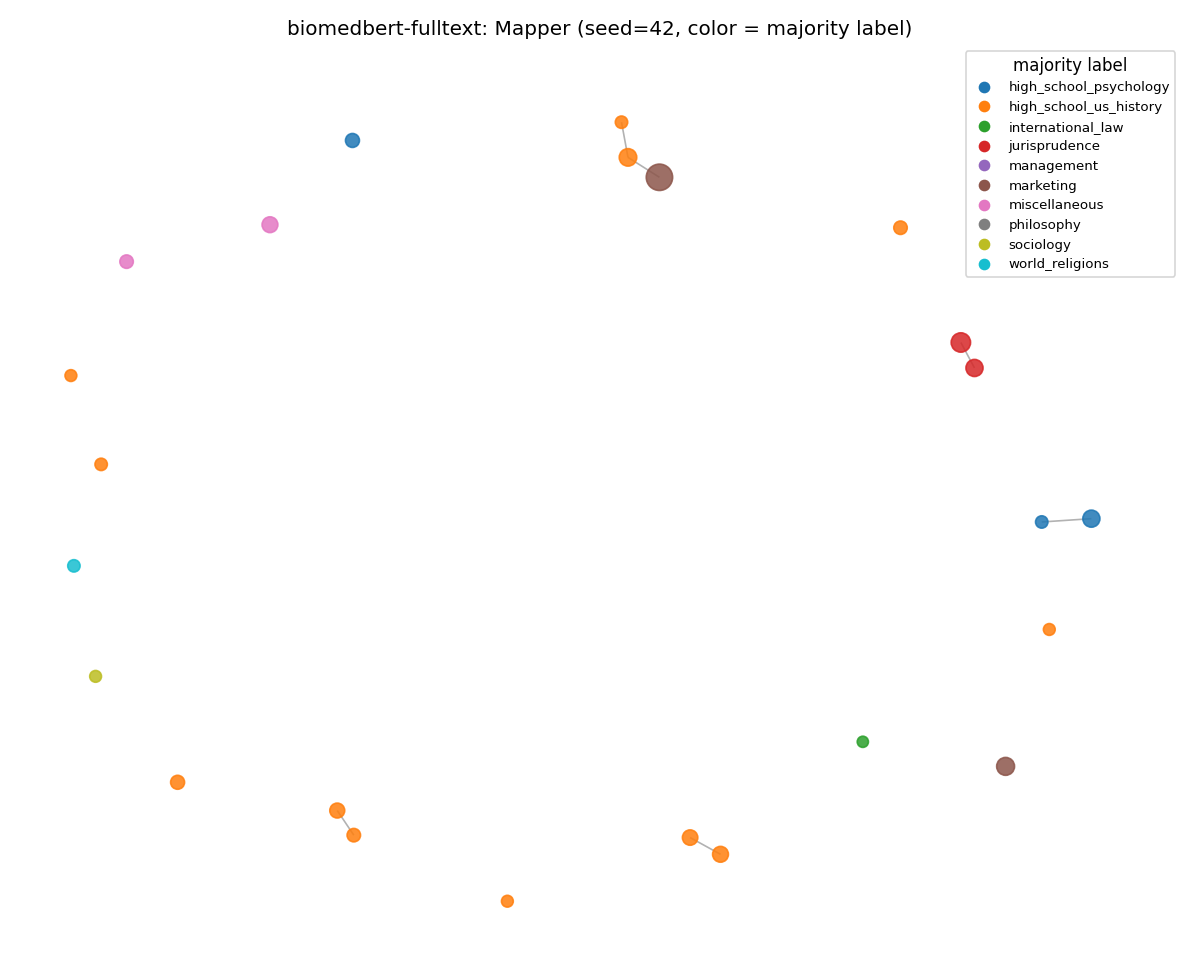
The opposite failure mode. The MMLU graph still has structure, and it isn't solely content structure. The clusters are organized by surface features (sentence length, syllable density) rather than subject. Compare to MedCPT above: same domain bias, same out-of-domain corpus, two completely different things going wrong.
bioformer-8l (held)
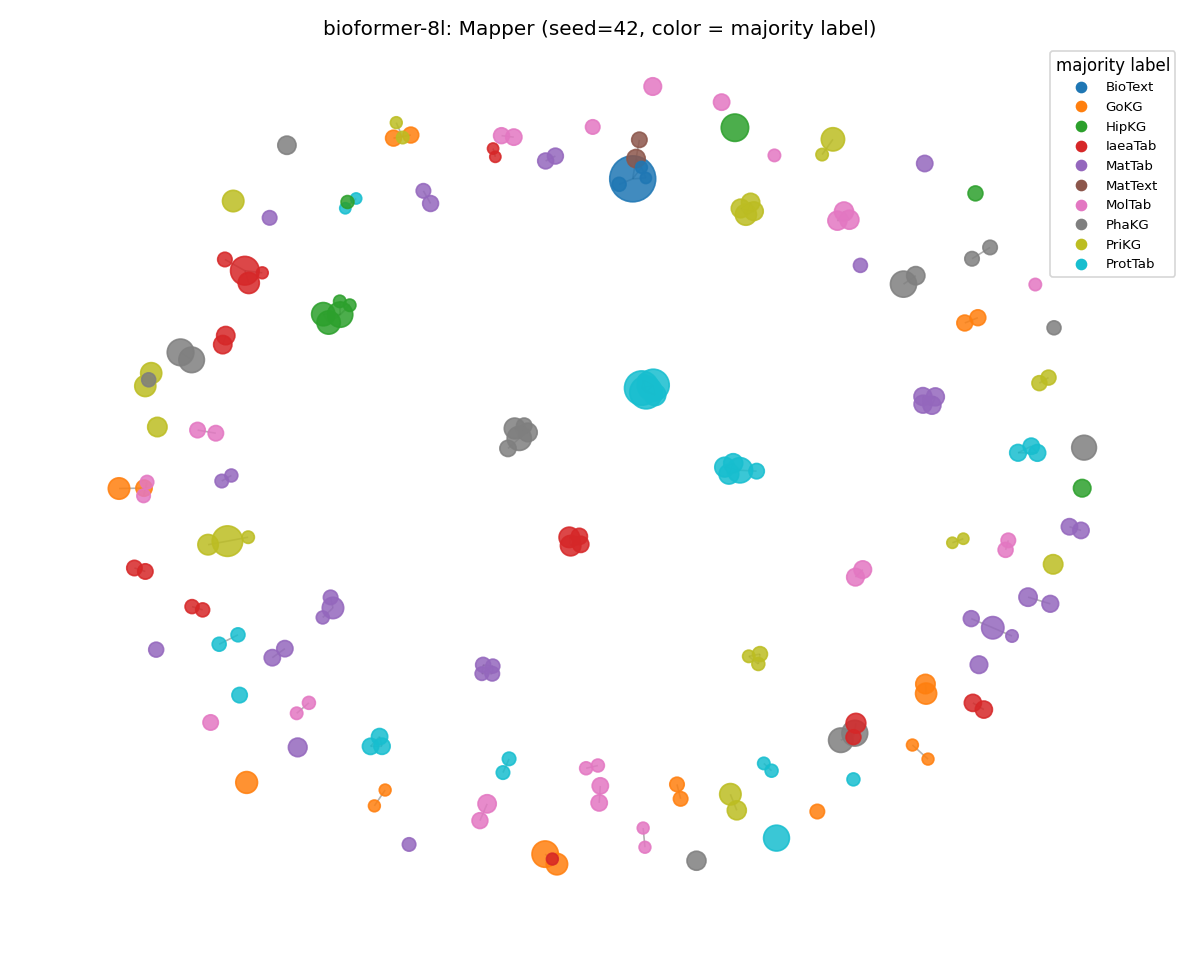
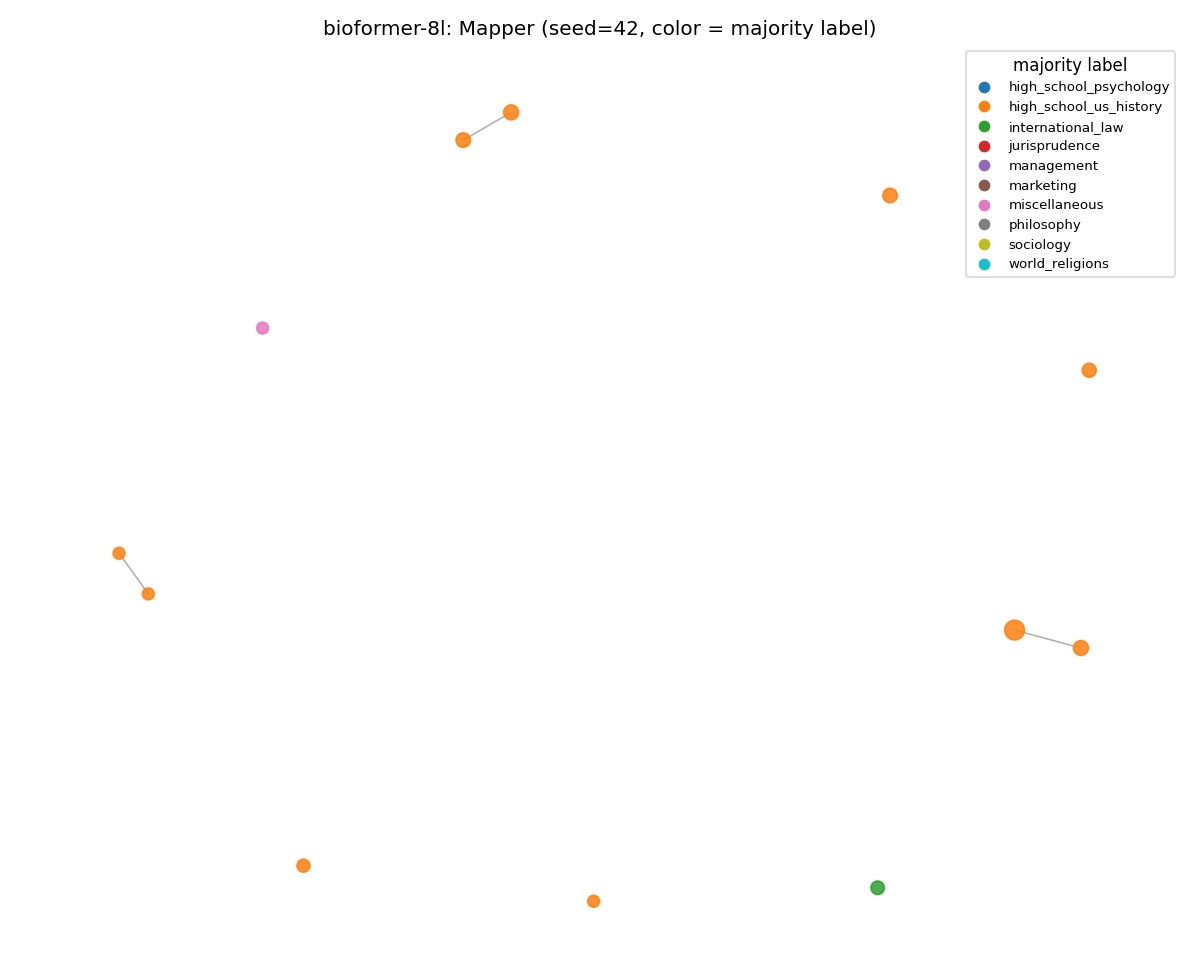
The MMLU graph is sparser because the corpus is smaller. However, the per-node coloring is just as clean as on SciCUEval. ARI moved 0.840 → 0.837, weighted purity up to the highest value seen on MMLU (0.975). The PubMed-only 8-layer encoder is the only one that organized out-of-domain prompts coherently across all three metrics.
bge-base (gained)
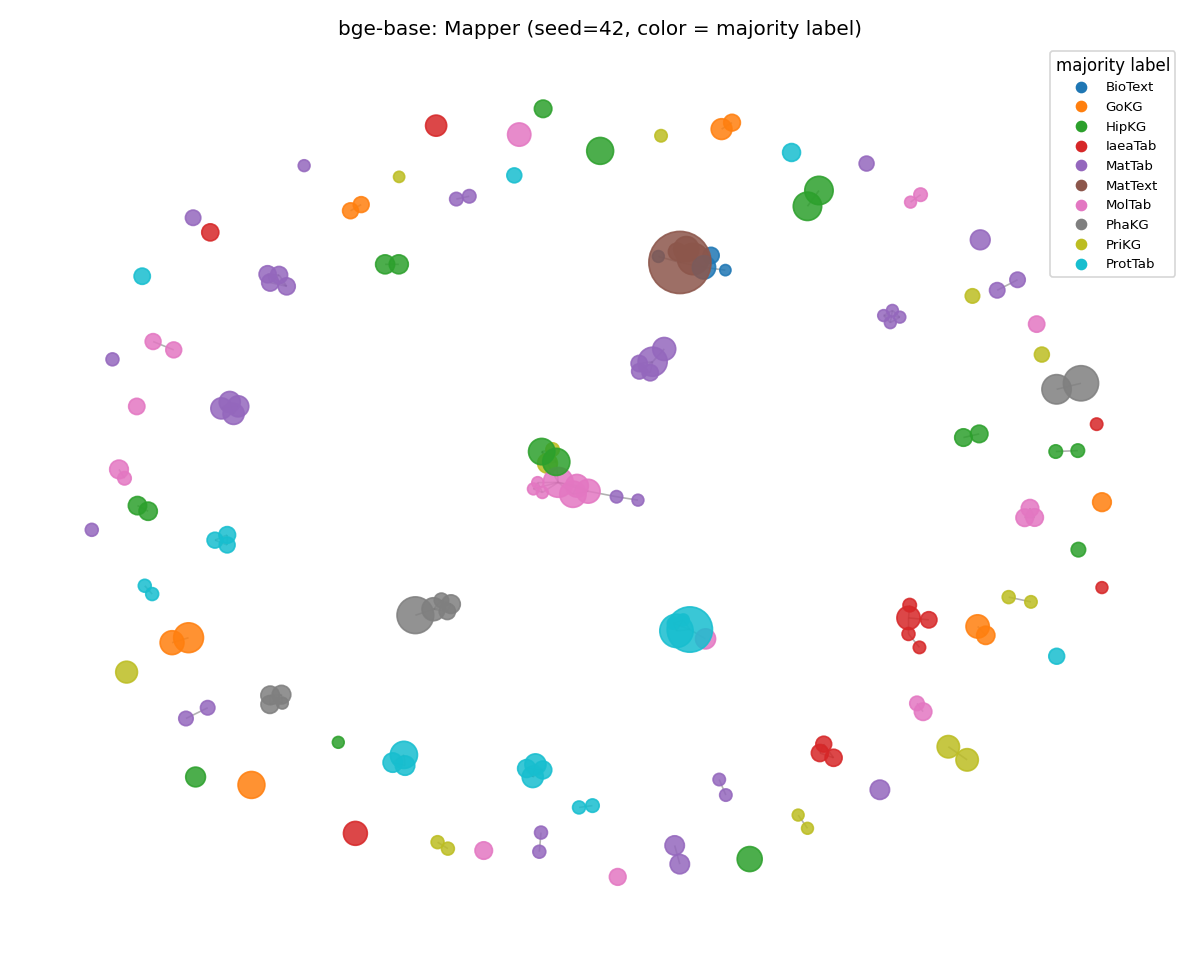
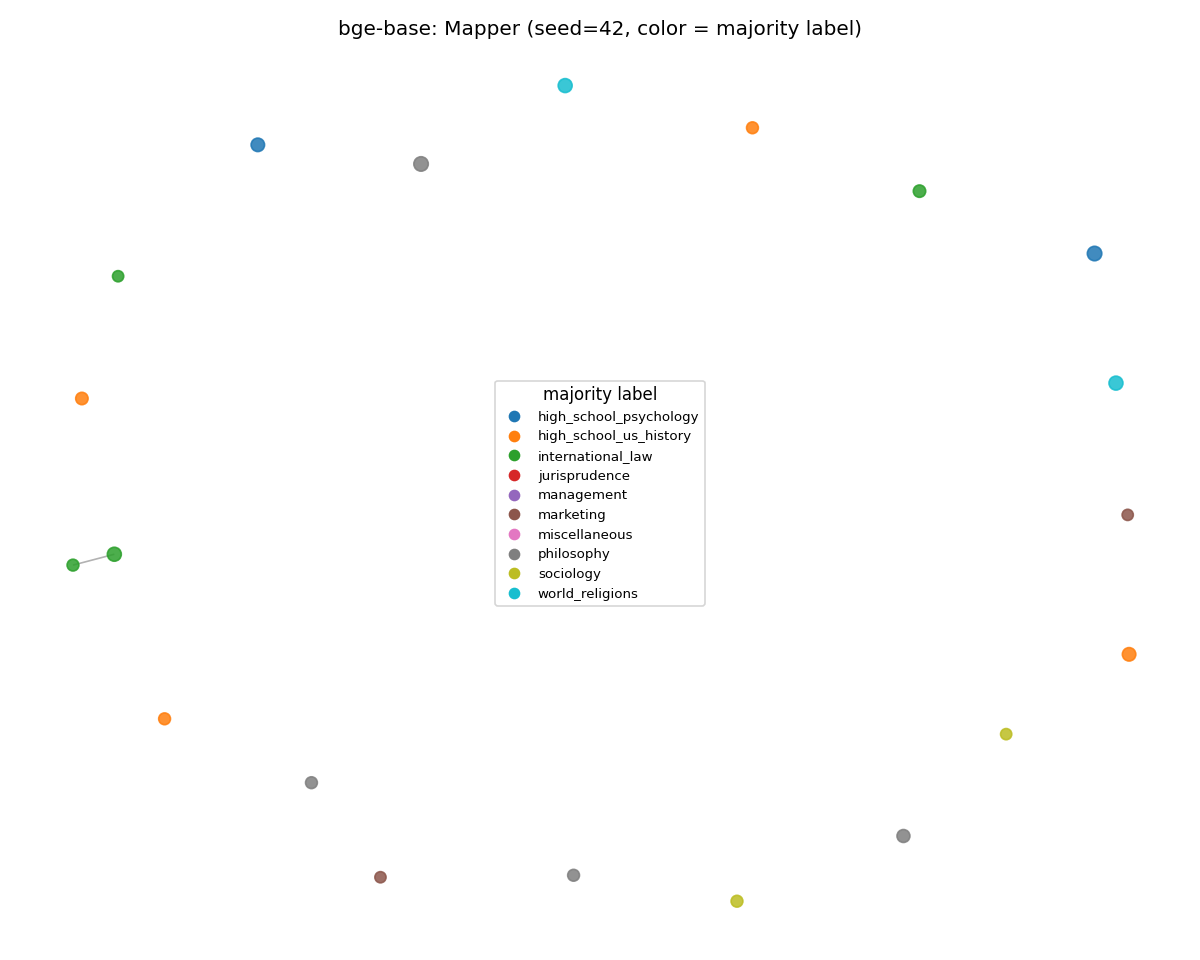
The general-purpose contrastive encoder consolidated into tighter regional clusters on MMLU than on SciCUEval. Its training distribution overlaps general-knowledge text more, so the manifold becomes more reproducible. ARI 0.766 → 0.880 (the new MMLU stability leader).
scibert (lost the most)
Visibly more color mixing within nodes — the categorical boundaries that were sharp on SciCUEval are blurred. Weighted purity dropped 0.941 → 0.737, the largest single-encoder drop in the run. SciBERT's broader-scientific training has more signal than pure PubMed for non-scientific text, but not enough to find clean subject boundaries in MMLU.
Interactive Mapper Graphs
Pick an encoder for each corpus to load its KeplerMapper graph at base seed 42. Hover any node for the first 200 characters of its member prompts.
Two comparisons worth running yourself:
- On SciCUEval, flip between
medcpt-queryandbioformer-8land notice how MedCPT's clusters are tighter and more regional while bioformer's are broader. - Flip both viewers to MMLU and watch MedCPT's graph collapse to a couple of nodes (the manifold-disintegration finding) while bioformer's stays organized (the surface-feature-fallback finding).
Caveats
A few things worth being honest about:
Coverage gap on MMLU. Mapper coverage on MMLU was 5-10x lower than on SciCUEval (0.05-0.20 vs 0.40-0.62) because the corpus is smaller and the prompts are shorter.
HDBSCAN's min_cluster_size=5 is harder to satisfy, and most documents land in HDBSCAN's outlier pool.
The metrics measure the topology of the covered region, which is real, but the Mapper graphs reflect a smaller fraction of the data.
Per-corpus tuning of Mapper params would close this gap; I held them fixed to keep the cross-corpus comparison apples-to-apples.
The pathological extreme: medcpt-query on MMLU produced 0.6% coverage and a mean Mapper node count of 1.84.
Almost the entire 2,450-prompt MMLU corpus landed in HDBSCAN's outlier pool.
That isn't a measurement artifact; it's the finding "manifold disintegration on out-of-domain text".
This does mean MedCPT's MMLU ARI of 0.962 is reading the stability of partitioning ~1 cluster across seeds, not a meaningful topological property.
I report the number for completeness, despite the anchor ρ = 0.000.
Single corpus pair. Two corpora make a contrast, not a generalization. Replicating on a third corpus of subjects like code prompts or conversational queries could either strengthen or complicate the thesis.
Mean-pool over attention mask is not the right pool for every encoder.
SPECTER2, E5 (query:/passage: prefixes), Nomic (search_query:/search_document: prefixes), and EmbeddingGemma (task: classification | query: {content}) all have prescribed conventions the apples-to-apples readout ignores.
I held mean-pool constant for cross-encoder comparability.
To measure the cost rather than just acknowledge it, EmbeddingGemma is run twice: prescribed prefix bumps SciCUEval cosine gap 0.026 → 0.039 and ARI 0.791 → 0.821.
A real effect, but Gemma-prescribed still lands in the MLM-cluster ranking, not with the modern contrastives.
Re-running every encoder with its preferred config could be a future hypothesis worth exploring.
Coverage and node count differ across encoders. When bge-base builds 30 nodes on MMLU and specter2 builds 46, the ARI numbers across encoders aren't measuring exactly the same thing. The within-encoder, across-seeds ARI is the apples-to-apples metric; cross-encoder comparison should be read in conjunction with the absolute graph statistics.
Logistic regression accuracy uses a single 80/20 train/test split with no cross-validation or calibration; k-fold CV would be more conservative. The selection criterion for the encoder is based on the topological metrics, not LR, so this doesn't change the conclusions.
Reproducing
Companion code: github.com/rbartelme/tda-embedder-bakeoff
The full analysis, plus the SciCUEval/MMLU adapters and run_full_bakeoff.sh for one-shot reproduction.
The analysis is three Python scripts plus two corpus adapters:
scicueval_to_jsonl.py/mmlu_to_jsonl.py— flatten each MCQ corpus into a uniform JSONL withquestionandsource_subsetfields.embedding_diagnostic.py— Layer 1 (cosine geometry). Encodes prompts with each encoder in the roster, computes within/between cosine distributions, centroid heatmaps, and an LR baseline. Cachesembeddings.npyper encoder for downstream use.embedding_tda.py— Layers 2 + 3 (Mapper + linguistic anchors). Reads the cached embeddings, runs a 25-seed UMAP-lens bootstrap into KeplerMapper with HDBSCAN on precomputed cosine, computes ARI/NMI partition stability, categorical purity, continuous-anchor Spearman ρ, per-feature alignment, and writes a 4-panel synthesis figure. Parallelized across seeds viaconcurrent.futures.ProcessPoolExecutor(UMAP single-threads itself whenrandom_stateis set, so the speedup comes from fanning seeds out across worker processes).
Full bake-off (encode + 25-seed x 14-encoder Mapper bootstrap x 2 corpora) runs in ~100 minutes end-to-end on a single laptop:
- NVIDIA RTX 4070 Laptop, 8 GB VRAM (300M Gemma variants and 273M Nomic, batched at
--batch-size 32with--max-length 256) - 16 logical CPU cores (8 used for the Mapper bootstrap pool. UMAP single-threads itself when
random_stateis set, so parallelism comes from fanning seeds out across worker processes) - 32 GB RAM (peak well below 16 GB; the embeddings + Mapper graphs are small)
- WSL2 / Linux 5.15 on Windows 11
Stage timings on this hardware:
- Layer 1 (cosine, both corpora) ≈ 15 min
- Layer 2+3 SciCUEval Mapper bootstrap ≈ 44 min
- Layer 1 MMLU ≈ 13 min
- Layer 2+3 MMLU Mapper bootstrap ≈ 26 min.
CPU-only inference is supported (set --device cpu) and adds roughly 4-6x to wall clock.
uv run python scripts/embedding_diagnostic.py \
    --data scratch/scicueval_combined.jsonl \
    --label-field source_subset \
    --encoder all \
    --sample-per-class 400 \
    --batch-size 32 \
    --device auto \
    --cache-embeddings --cache-corpus \
    --out-dir scratch/diagnostic_subset

uv run python scripts/embedding_tda.py \
    --diagnostic-dir scratch/diagnostic_subset \
    --out-dir scratch/tda_subset \
    --n-seeds 25 \
    --n-workers 8
Or run the whole analysis (downloads + cosine + TDA x both corpora) in one shot via bash run_full_bakeoff.sh after export HF_TOKEN=... is set in your CLI environment.
References And Further Reading
- Rathore, A., Zhou, Y., Srikumar, V., Wang, B. (2023). TopoBERT: Exploring the topology of fine-tuned word representations. Information Visualization. — Methodologically closest precedent.
- "When Annotators Disagree, Topology Explains: Mapper, a Topological Tool for Exploring Text Embedding Geometry and Ambiguity" (2025). — Argues Mapper captures structure UMAP alone flattens; source of the seed-bootstrap design.
- Draganov, O., Skiena, S. (2024). The shape of word embeddings: Quantifying non-isometry with topological data analysis. — Recovers linguistic phylogeny from FastText embeddings via TDA; methodological inspiration for using known linguistic structure to validate topology.
- Uchendu, A., Le, T. (2024). Unveiling Topological Structures from Language: A Comprehensive Survey of TDA Applications in NLP. — Field survey, good entry point.
- Awesome TDA for NLP — maintained reading list.
Have thoughts on embedder selection or topological evaluation? Find me on Bluesky or LinkedIn.
Note: This post was written by me based on my own experiments and analysis. In all transparency, I used Claude (Anthropic's AI assistant) as a pair-programming partner to co-write the evaluation analyses (the cosine diagnostic, the Mapper bake-off harness, and the corpus adapters), and to help scaffold this post from the experimental results. The experiments, the interpretations, prose, and the thesis are mine.